Support Manager
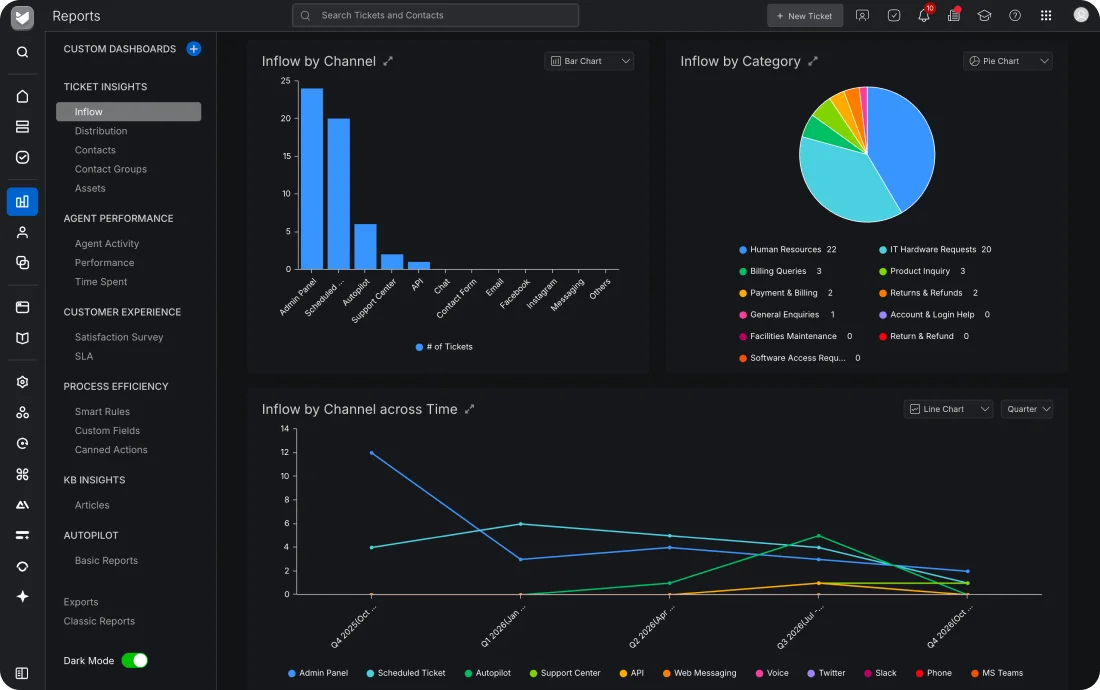
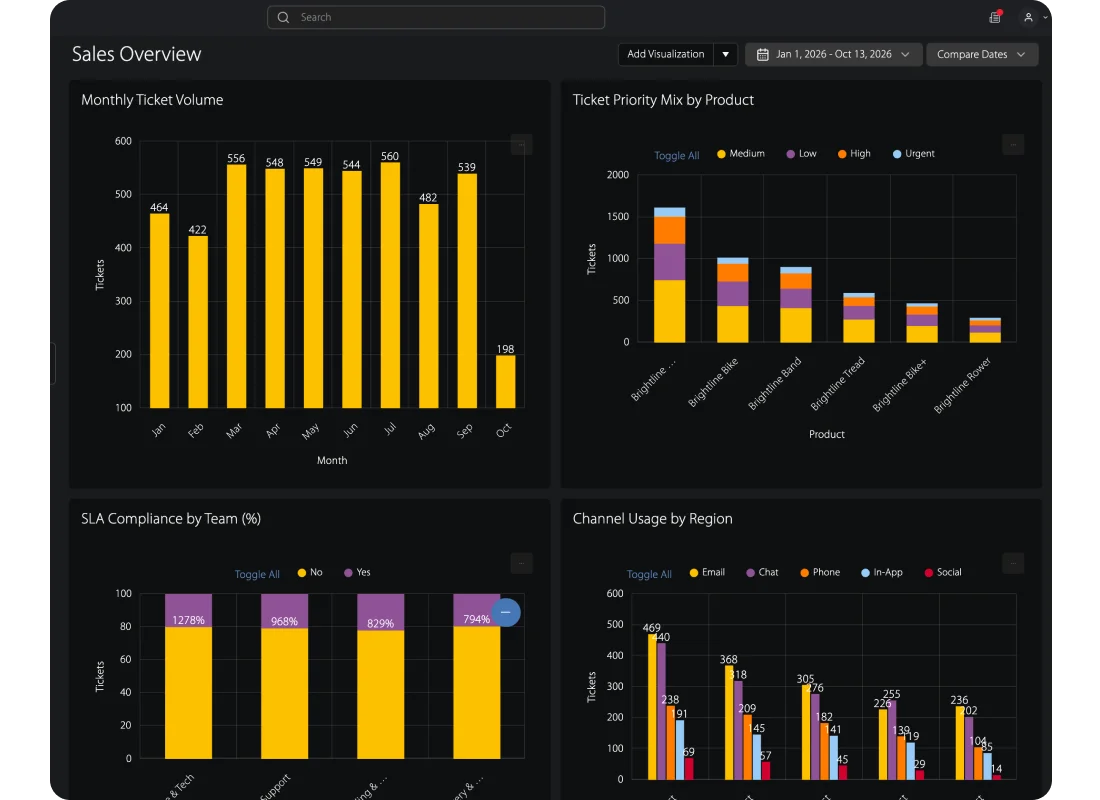
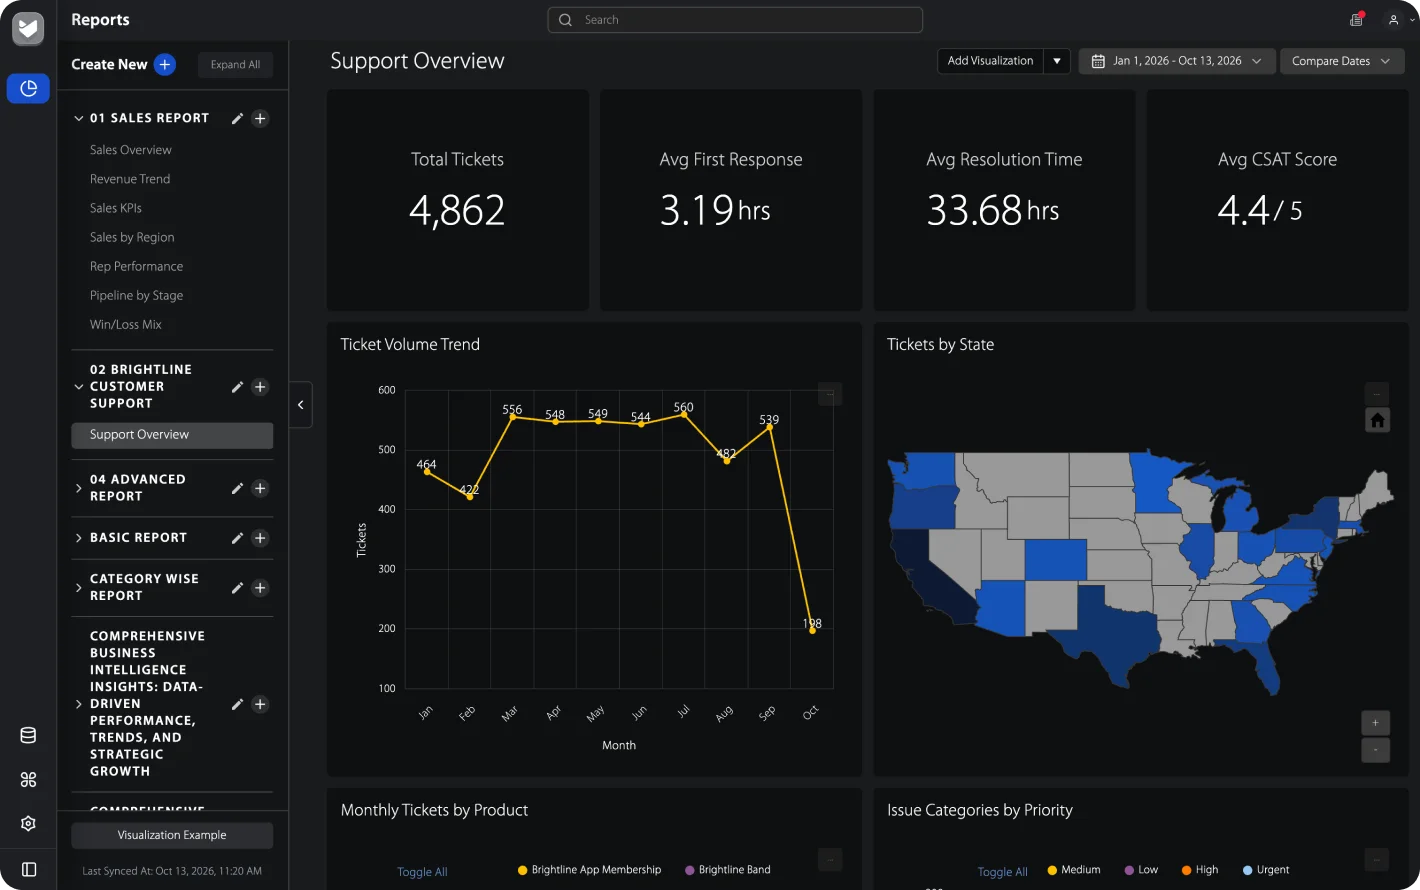
Real-time dashboards and custom reports reveal team performance, SLA compliance, and bottlenecks at a glance.
 Business Intelligence
Trusted by Industry-Leading Companies




Real-time dashboards and custom reports reveal team performance, SLA compliance, and bottlenecks at a glance.
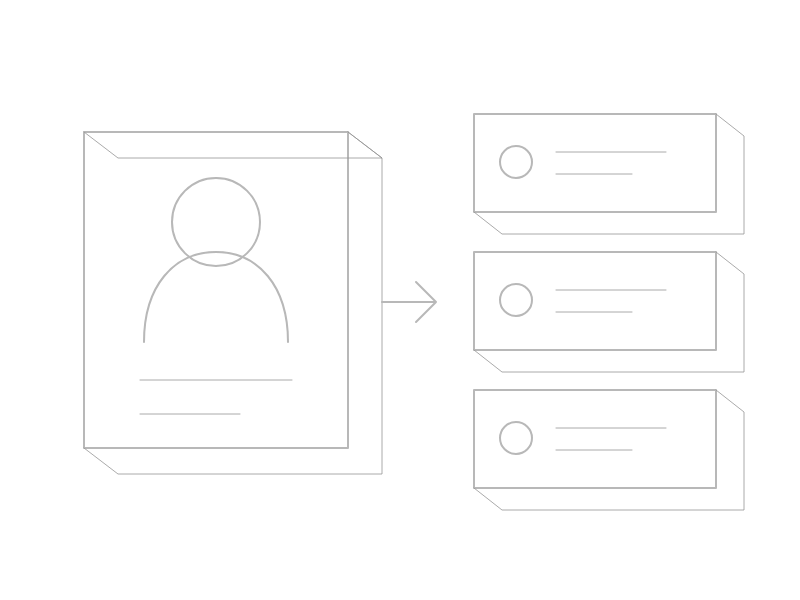
Personal performance metrics and ticket insights help you understand your impact and identify areas for growth.
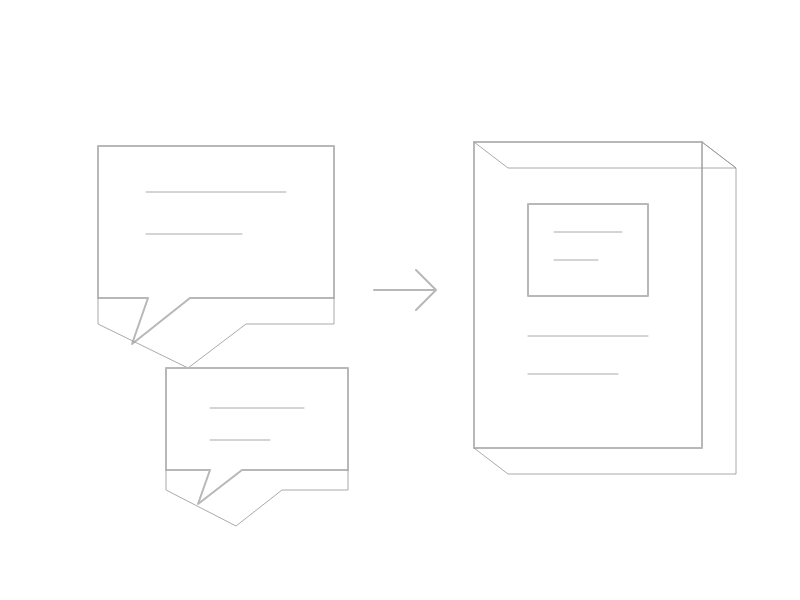
Executive-level visualizations and scheduled reports keep leadership informed without manual data pulls.
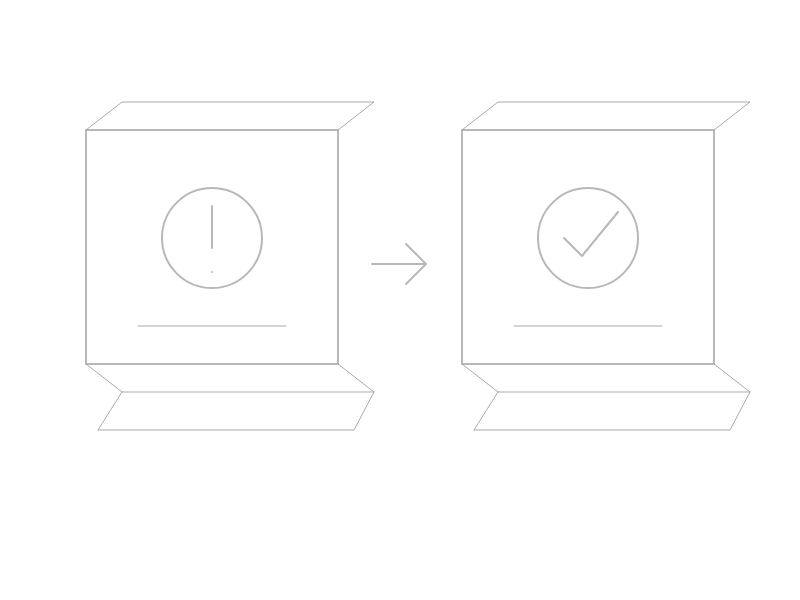
Advanced filtering, drill-downs, benchmarks, and raw data exports give you the depth you need for thorough analysis.
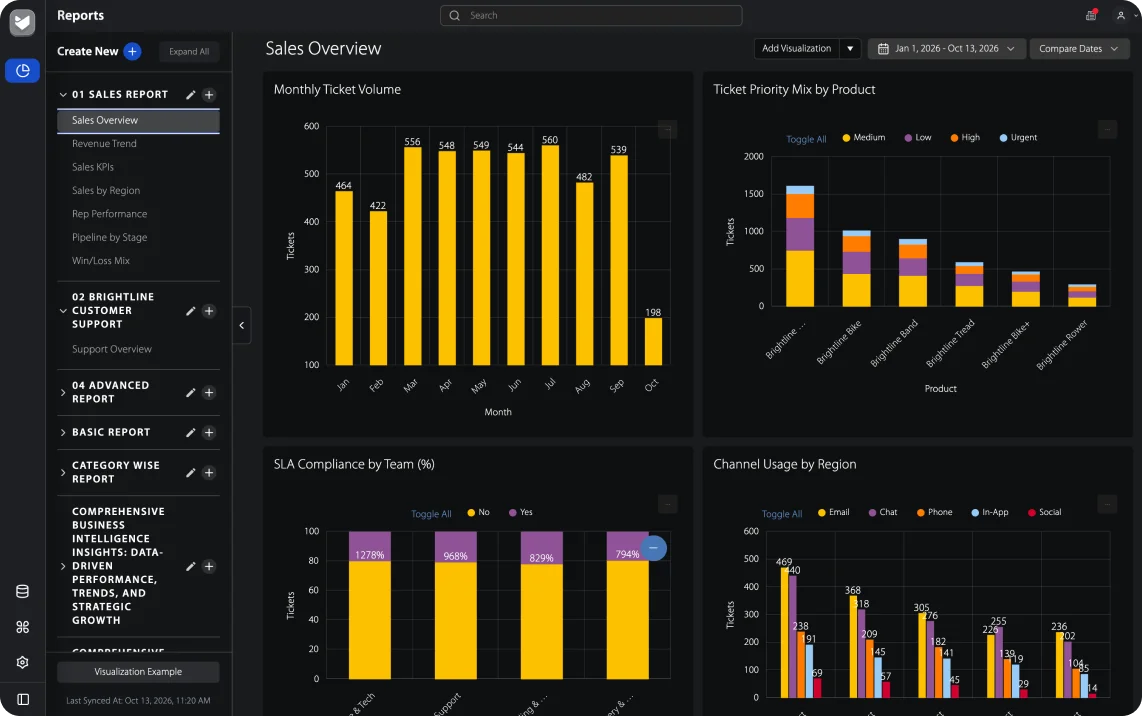
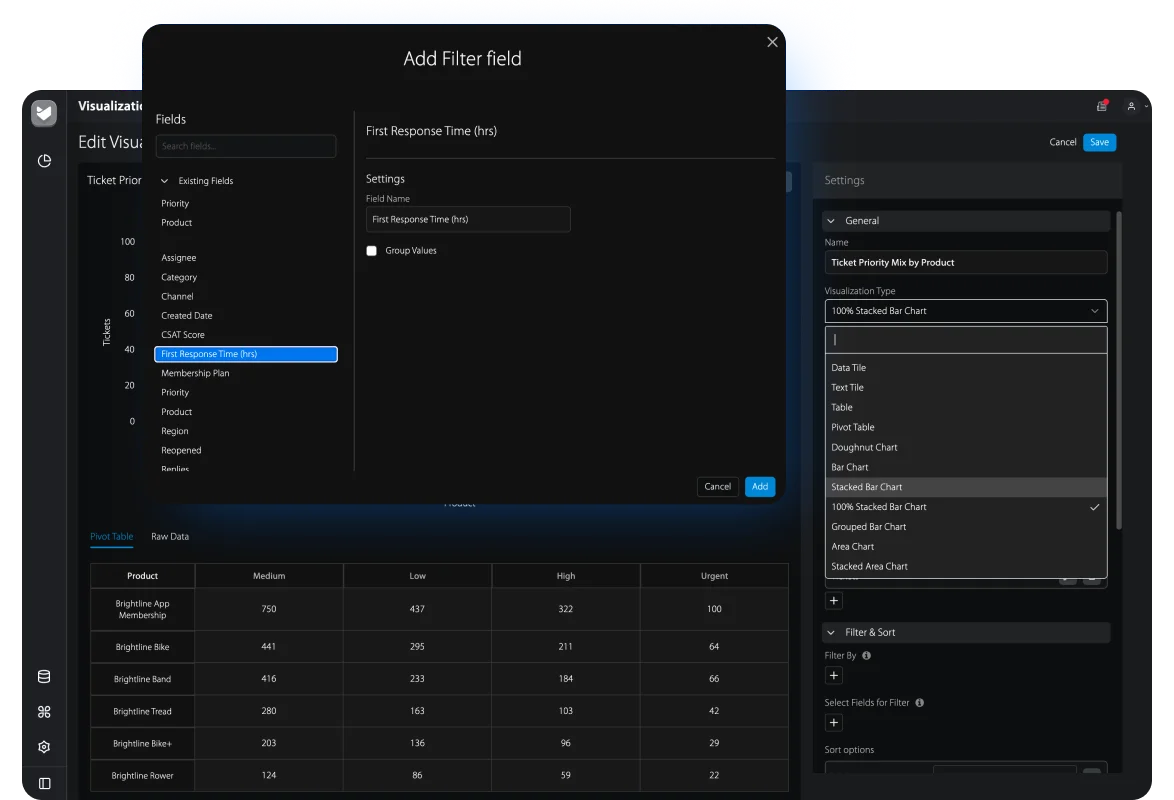

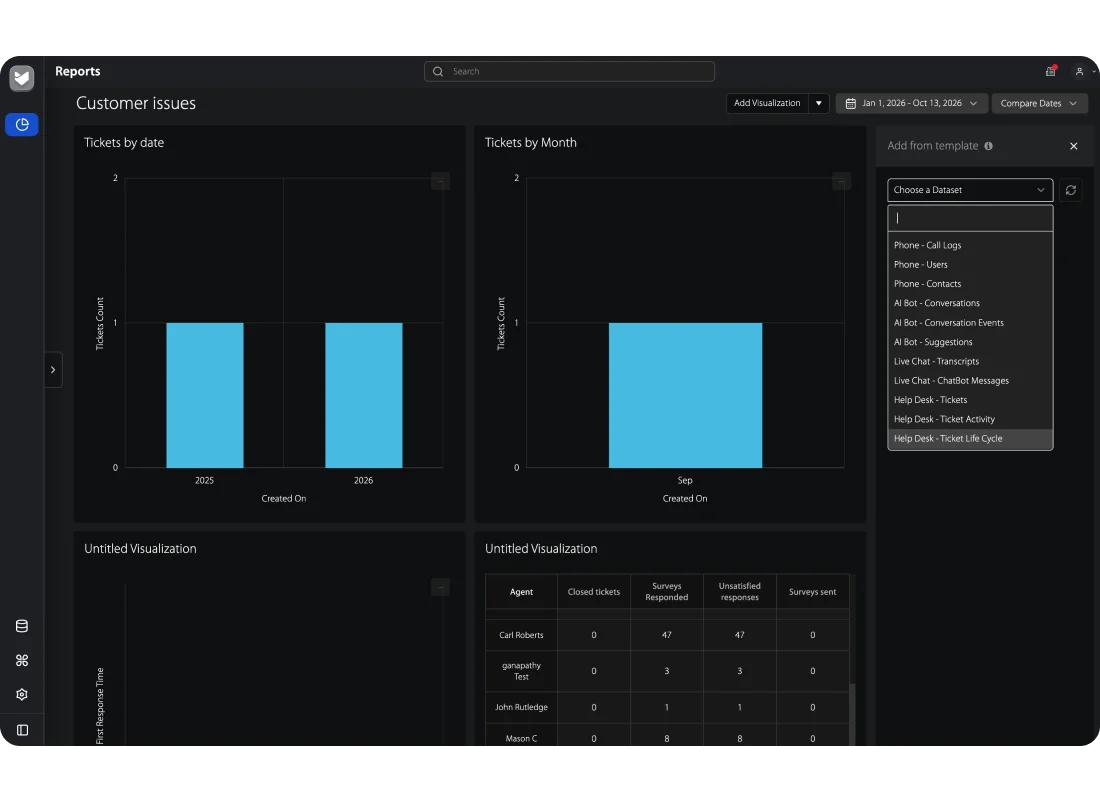
Compare categories at a glance. Visualize ticket volumes, agent performance, or any categorical data with clear, easy-to-read bar charts.
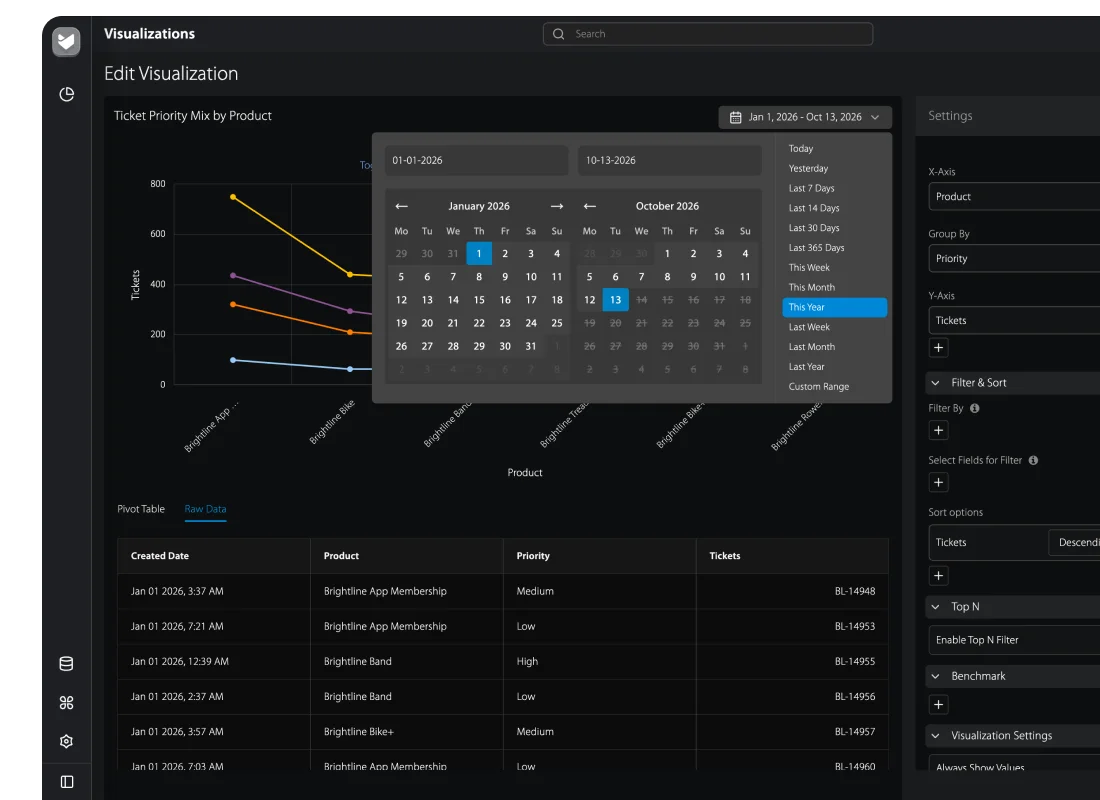
Track trends over time. Monitor ticket inflow, resolution times, and other metrics as they change day-over-day, week-over-week, or month-over-month.
Analyze multi-dimensional data. Cross-tabulate your data to uncover patterns and relationships that simple charts might miss.
Highlight key metrics. Display important KPIs front and center with bold, attention-grabbing data tiles on your dashboards.
Focus on what matters. Filter reports by custom date ranges to analyze specific periods, campaigns, or events.
Measure progress. Compare this week to last week, this month to last month—see exactly how your team is improving.
Go deeper. Click into any data point to explore the underlying details and root causes.
Automate delivery. Schedule reports to be delivered automatically to stakeholders via email.


“HappyFox has not just been a tool; it's been a game-changer for Sonny's BBQ. The efficiency and clarity it brought to our IT support and business intelligence processes have allowed us to significantly reduce ticket volumes while improving our operational insights. This isn't just about solving IT issues; it's about elevating the entire brand's operational excellence.”
“Transitioning to HappyFox was transformative, streamlining our workflow and expediting response times for facilities-related repairs. With top-notch customer service, we enthusiastically recommend HappyFox for asset and service management optimization.”

“We could craft our experiences around each of our departments so that the platform worked for them. Our ability to grow and change within our pricing tier was also something that was better than most of the other platforms out there.”
“We really like how easy it is to have multiple brands and separate email categories with their own emails and email signatures. It has made us far more efficient and has eliminated duplicate work, missed emails, etc.”