


Unlock Insights from Your Custom Field Data


Custom Fields Without Visibility Leave You Flying Blind
You've set up custom fields to capture critical ticket data—but without proper reporting, that valuable information sits unused. Which custom field values are trending? How are tickets distributed across different categories? Without clear visibility, you're missing opportunities to spot patterns, optimize workflows, and improve team performance.
What is the Custom Fields Report?
Custom Fields Report enables you to view all statistics related to custom field usage in your help desk. With a quick glance, identify how often certain ticket or contact custom fields are being used and which values are most common.
20
Custom Fields at Once
Select up to 20 custom fields for visualization—get a comprehensive view of your data in one report.
Real-time
Data Distribution
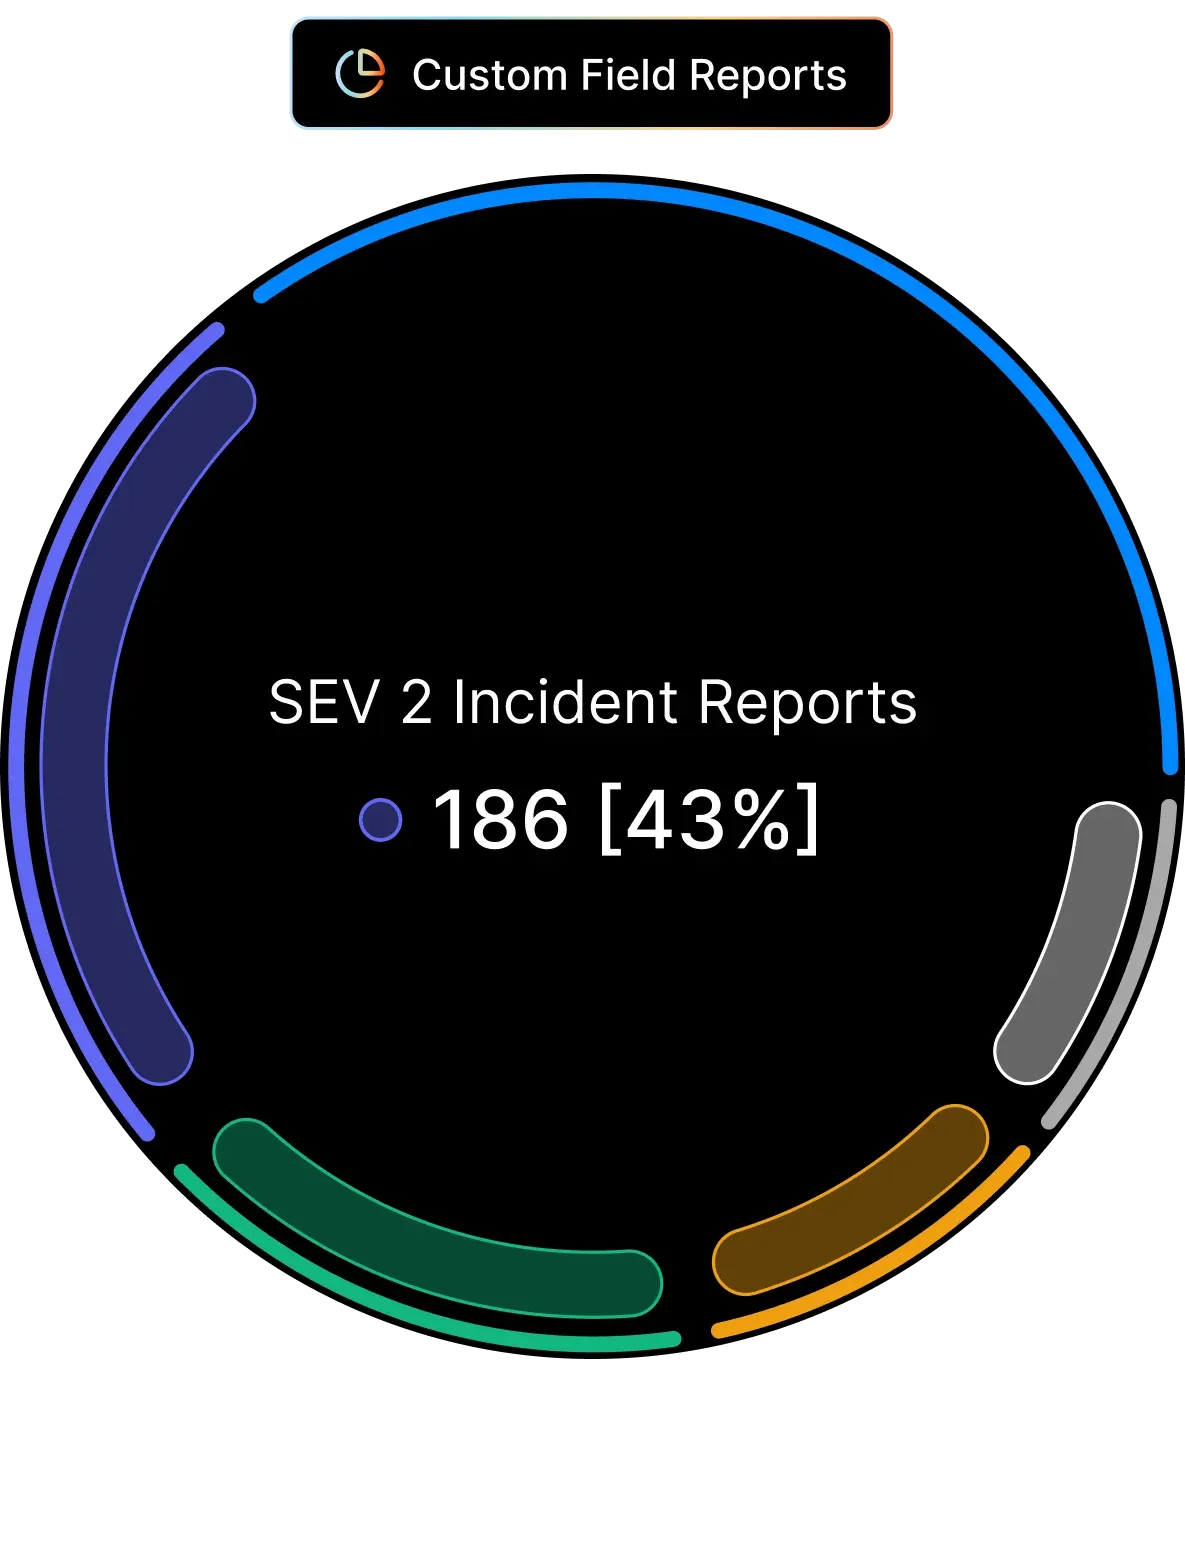
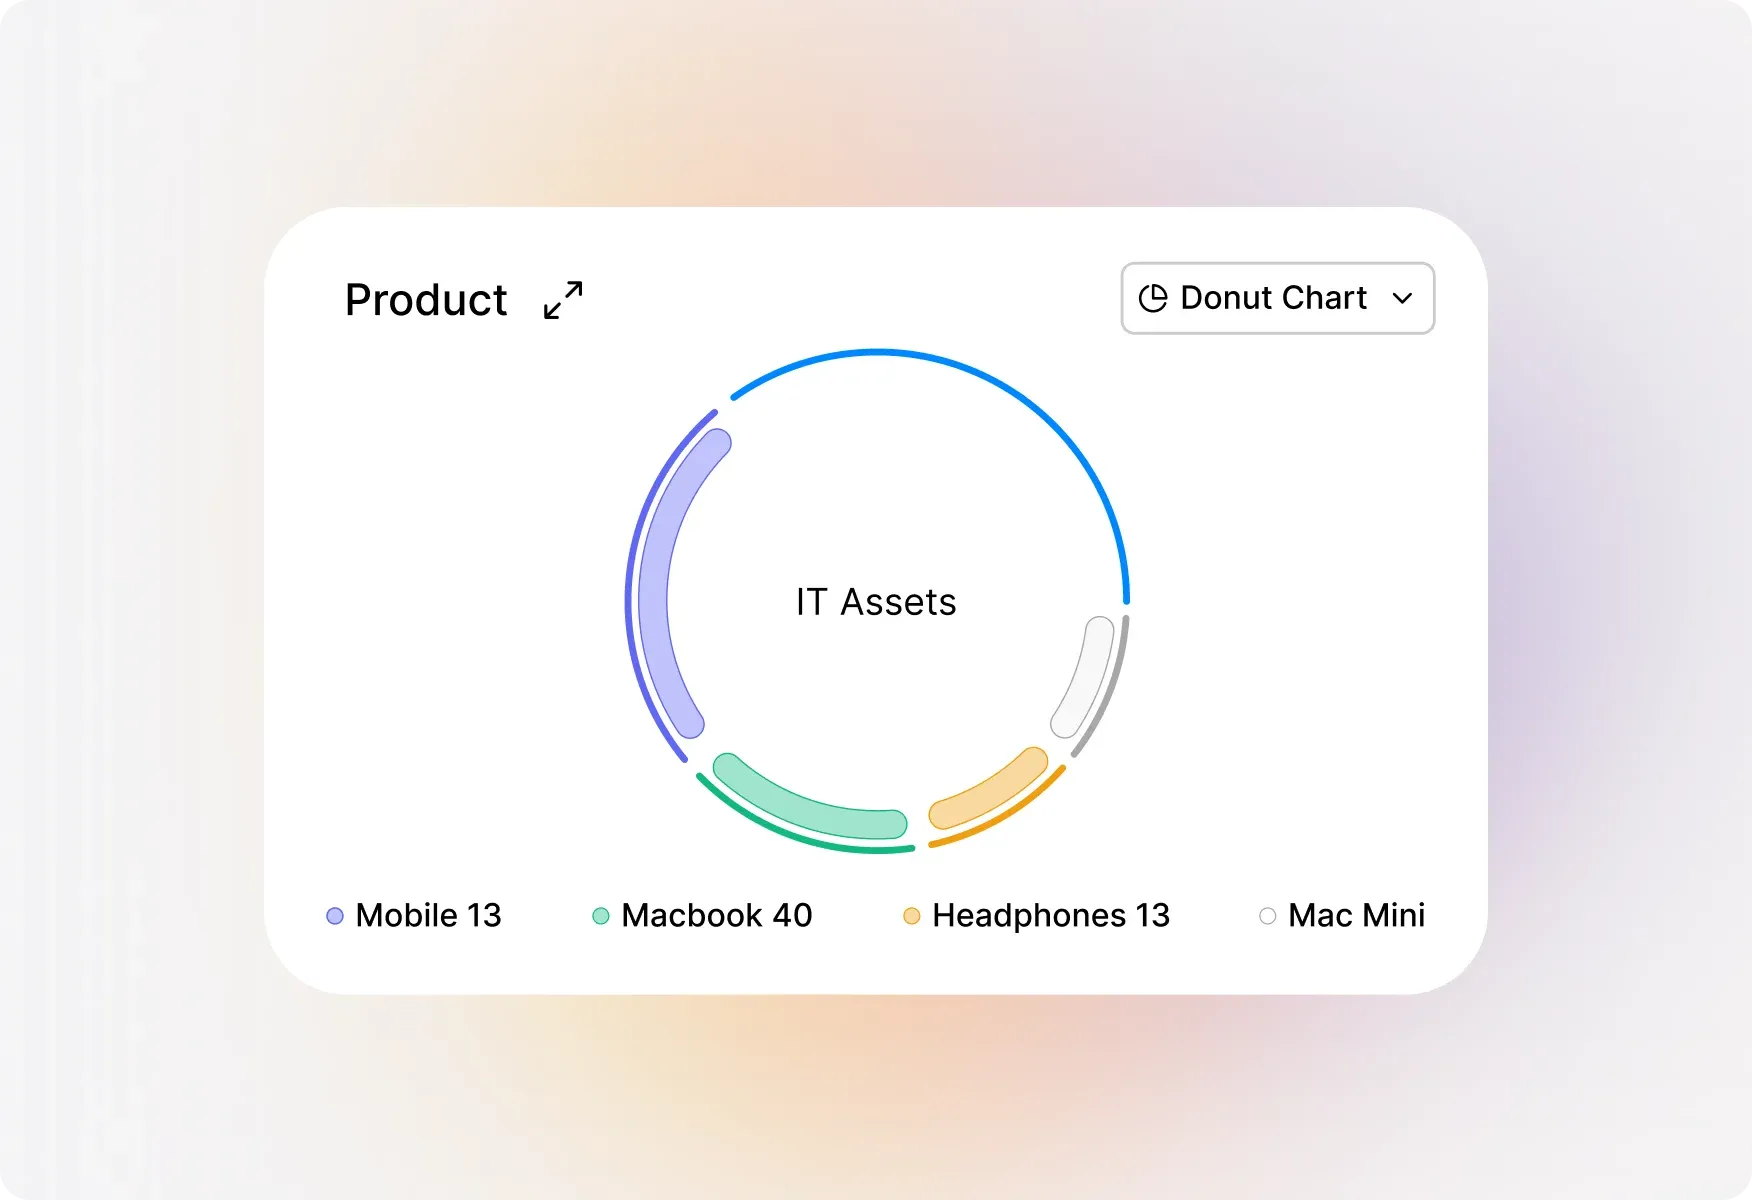
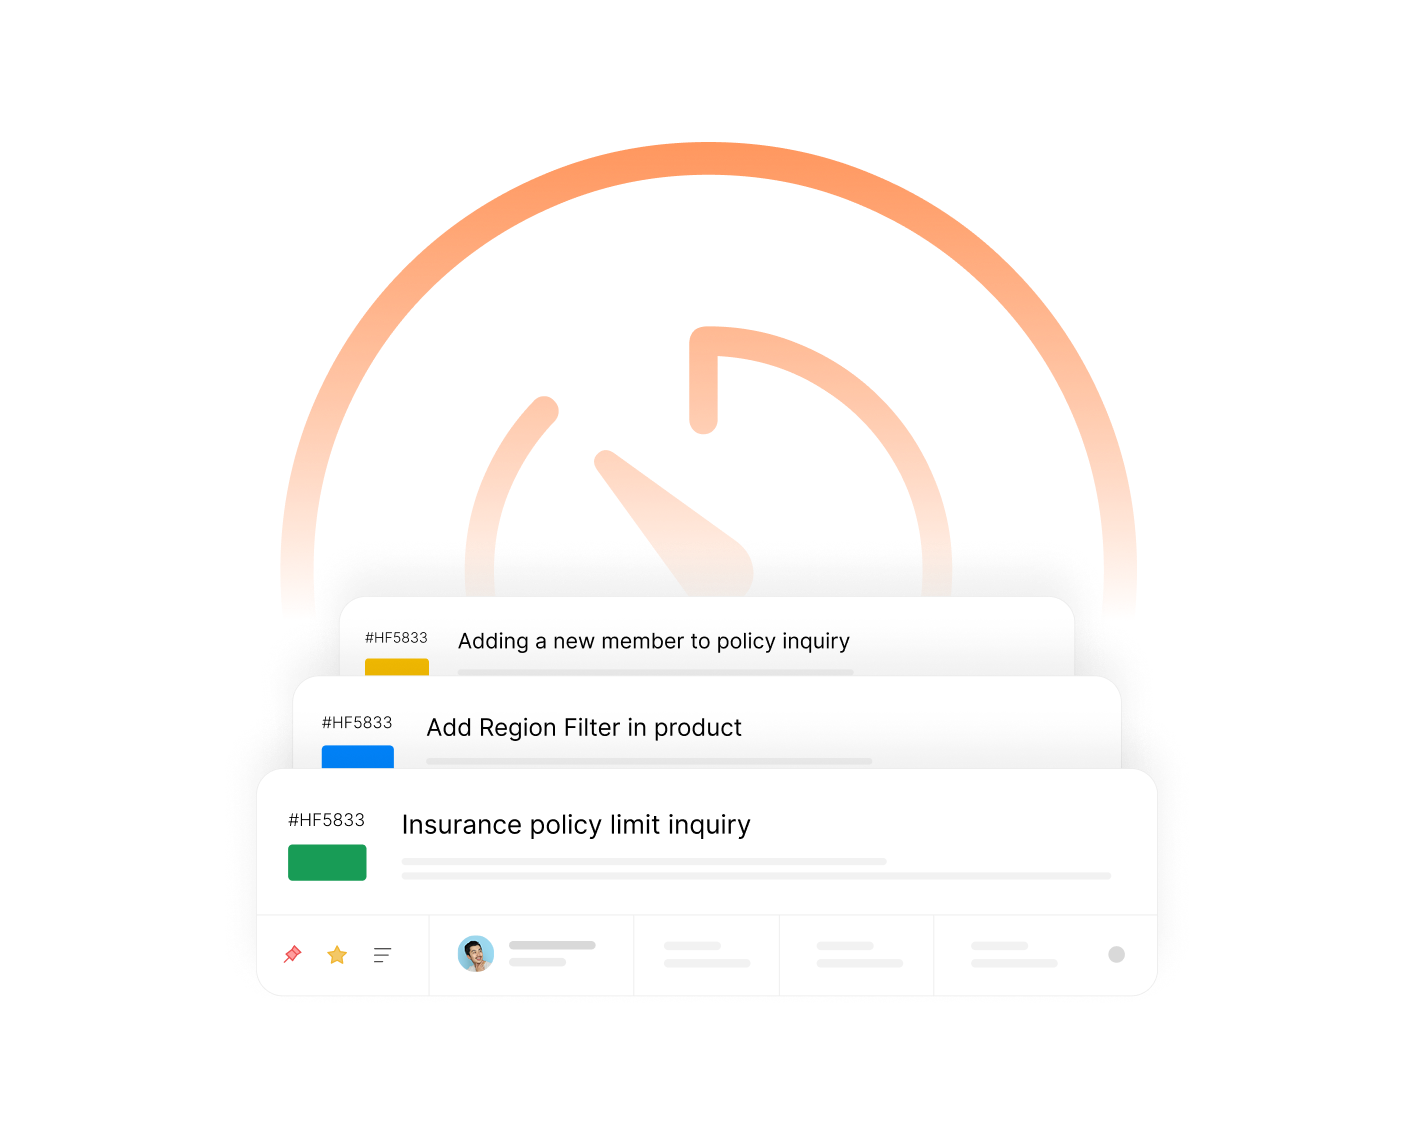
See the real-time distribution of custom field values for tickets created during any specified time frame.
100%
Trend Visibility
Track how custom field values change over time with timeline-based visualizations and heat maps.
Powerful Custom Field Analytics at Your Fingertips
Static Widgets for Real-Time Distribution
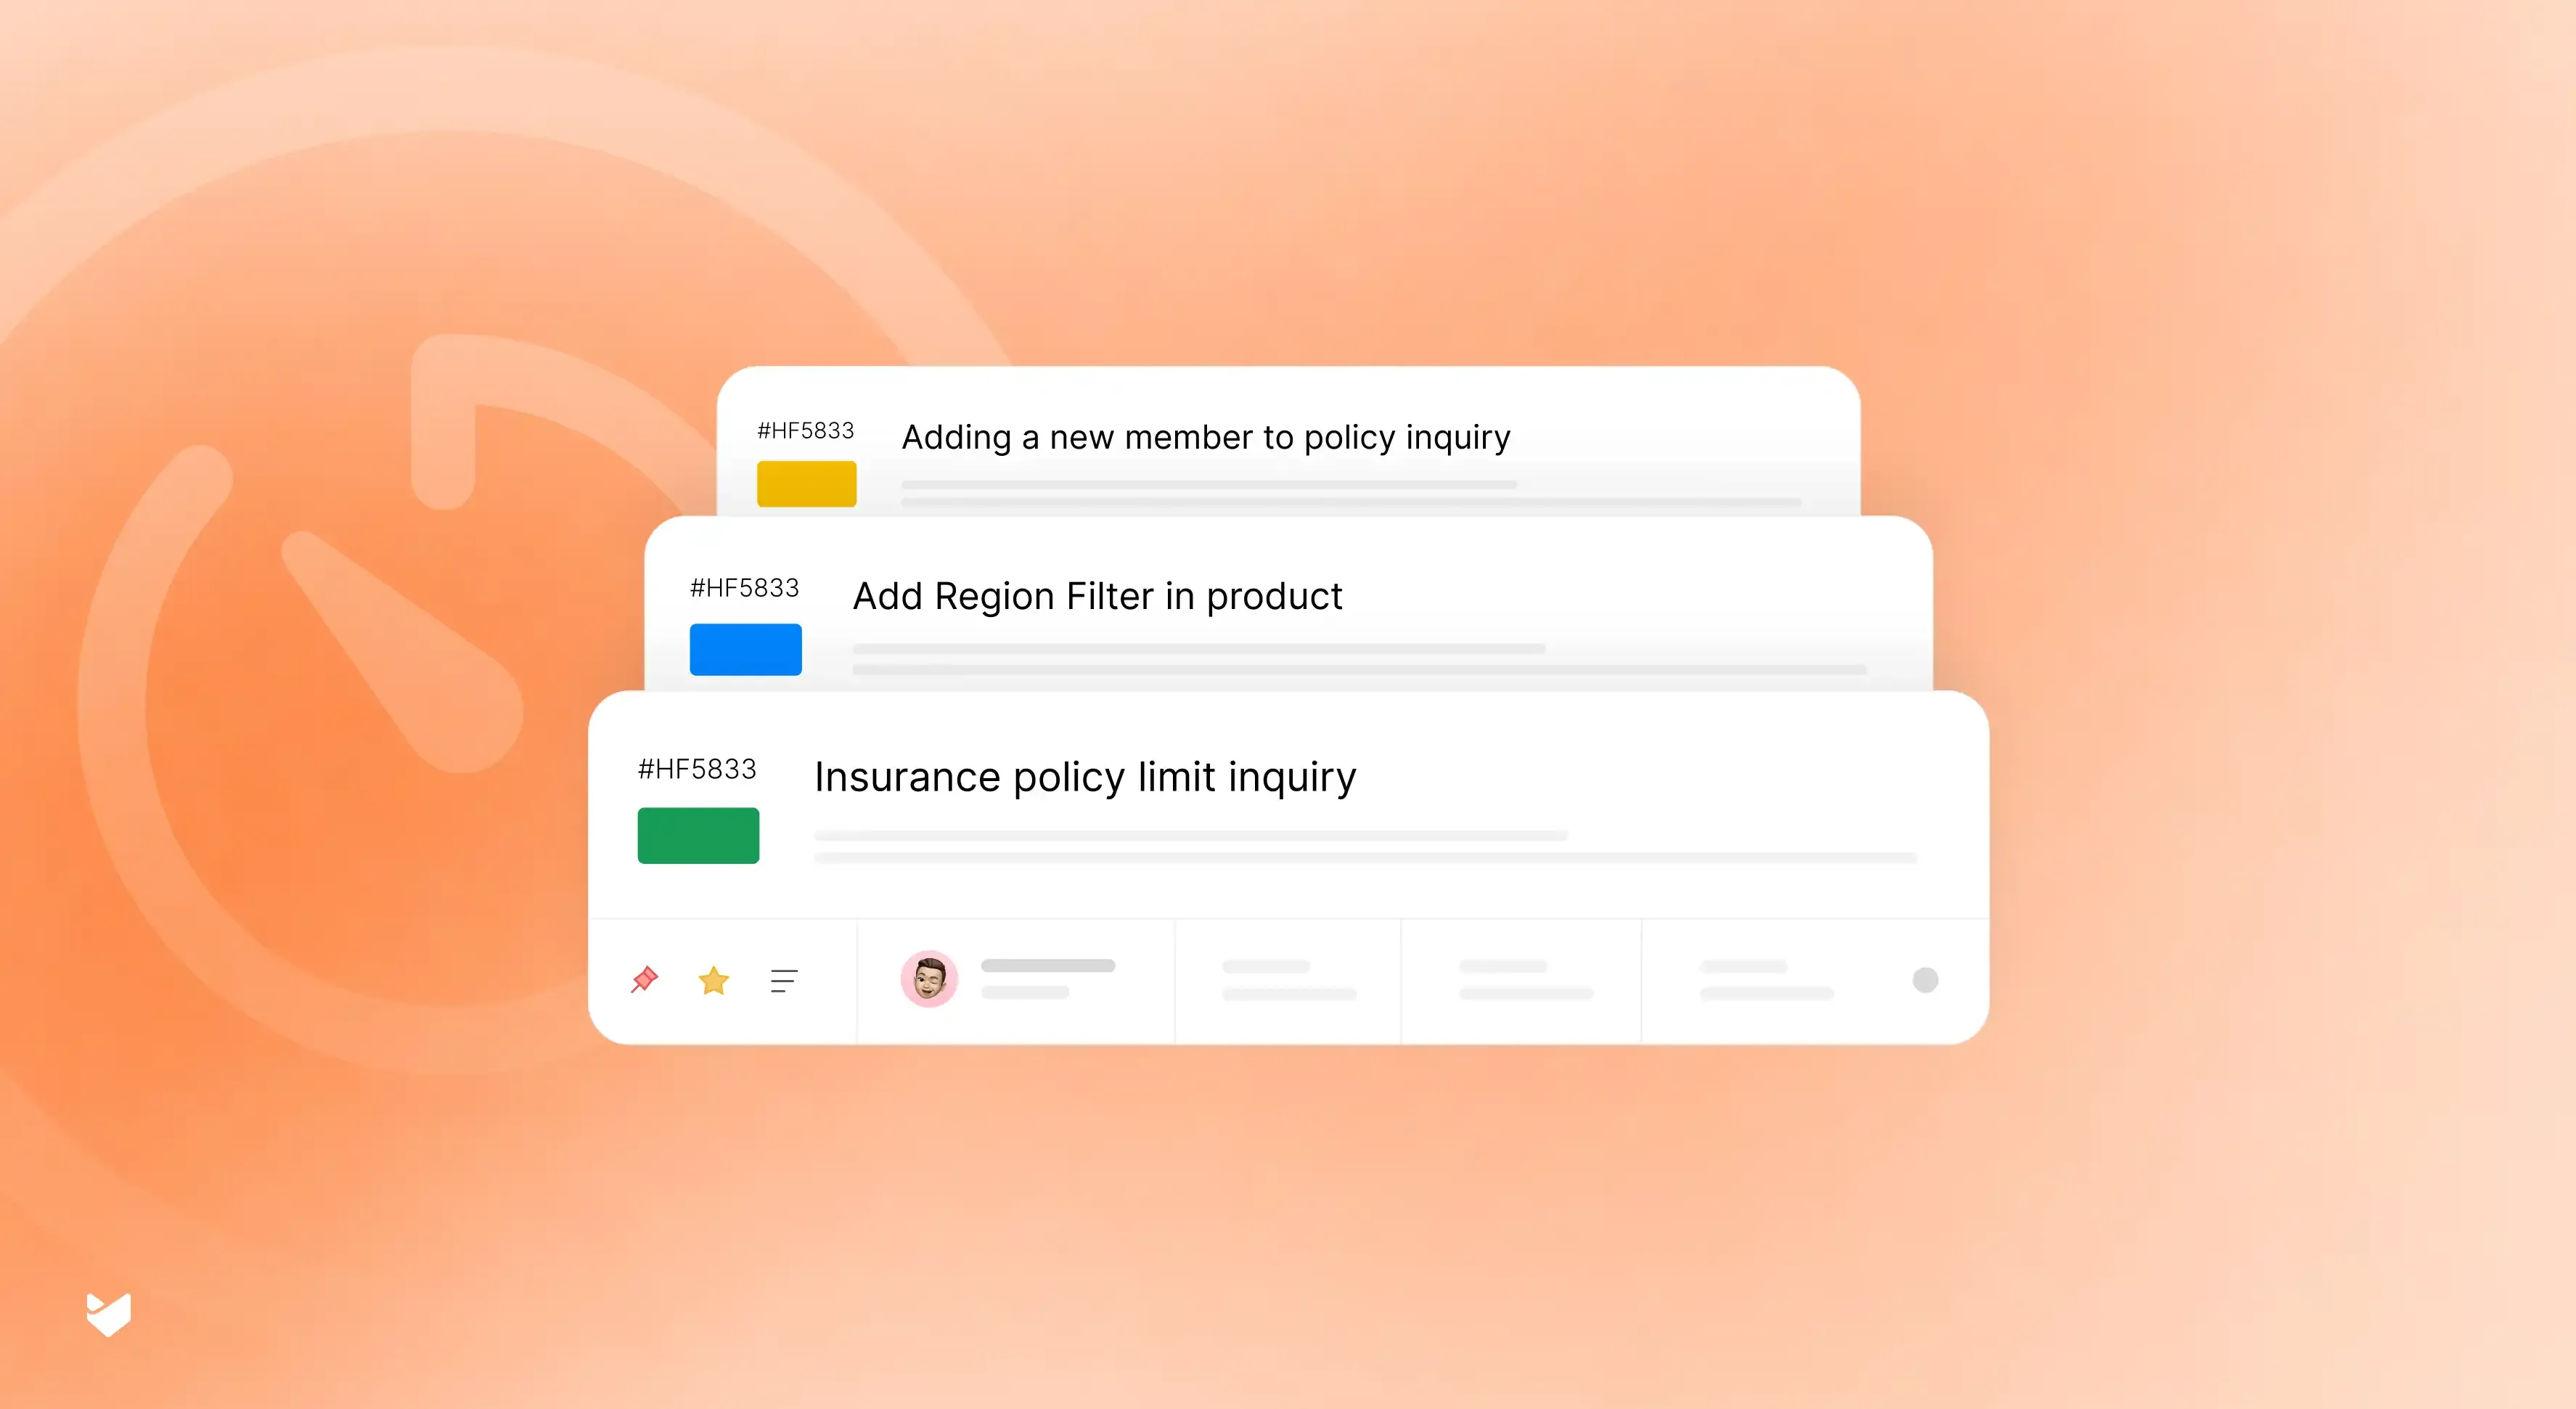
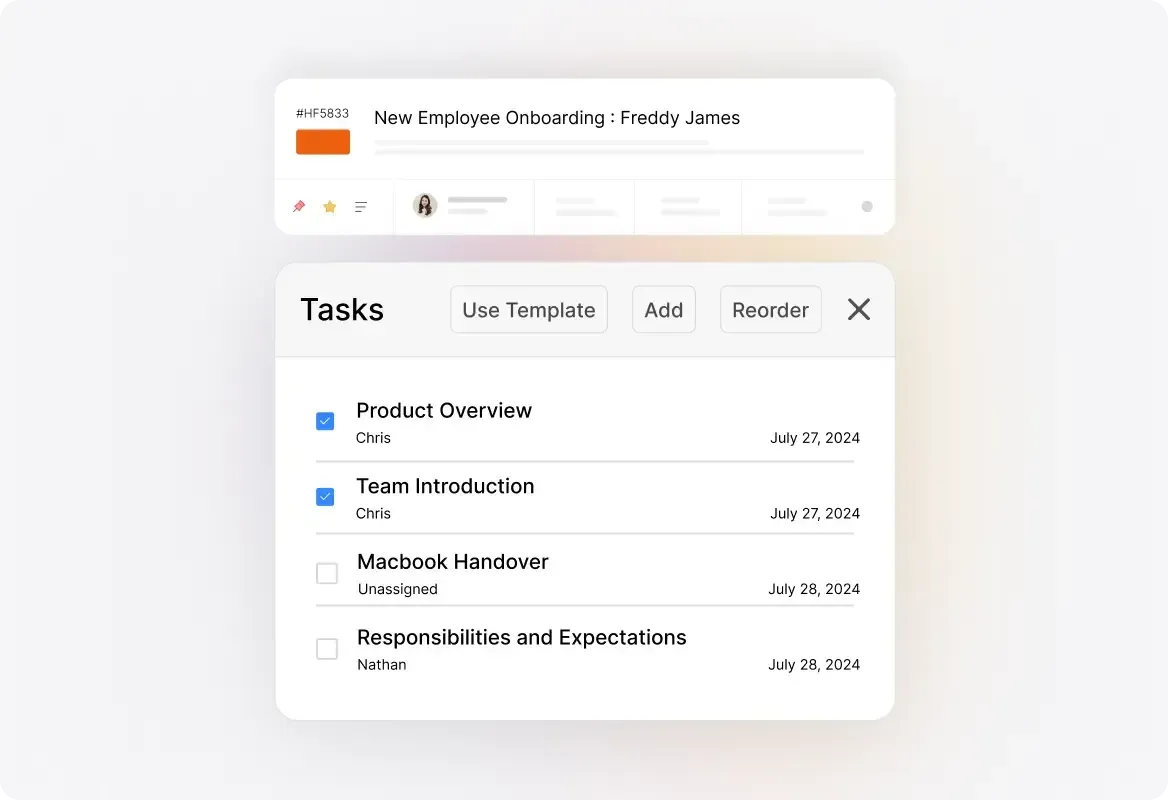
Each selected custom field gets its own static widget showing real-time distribution of values. Drag and reorder widgets to match your workflow—new widgets automatically appear at the bottom as you add more fields.
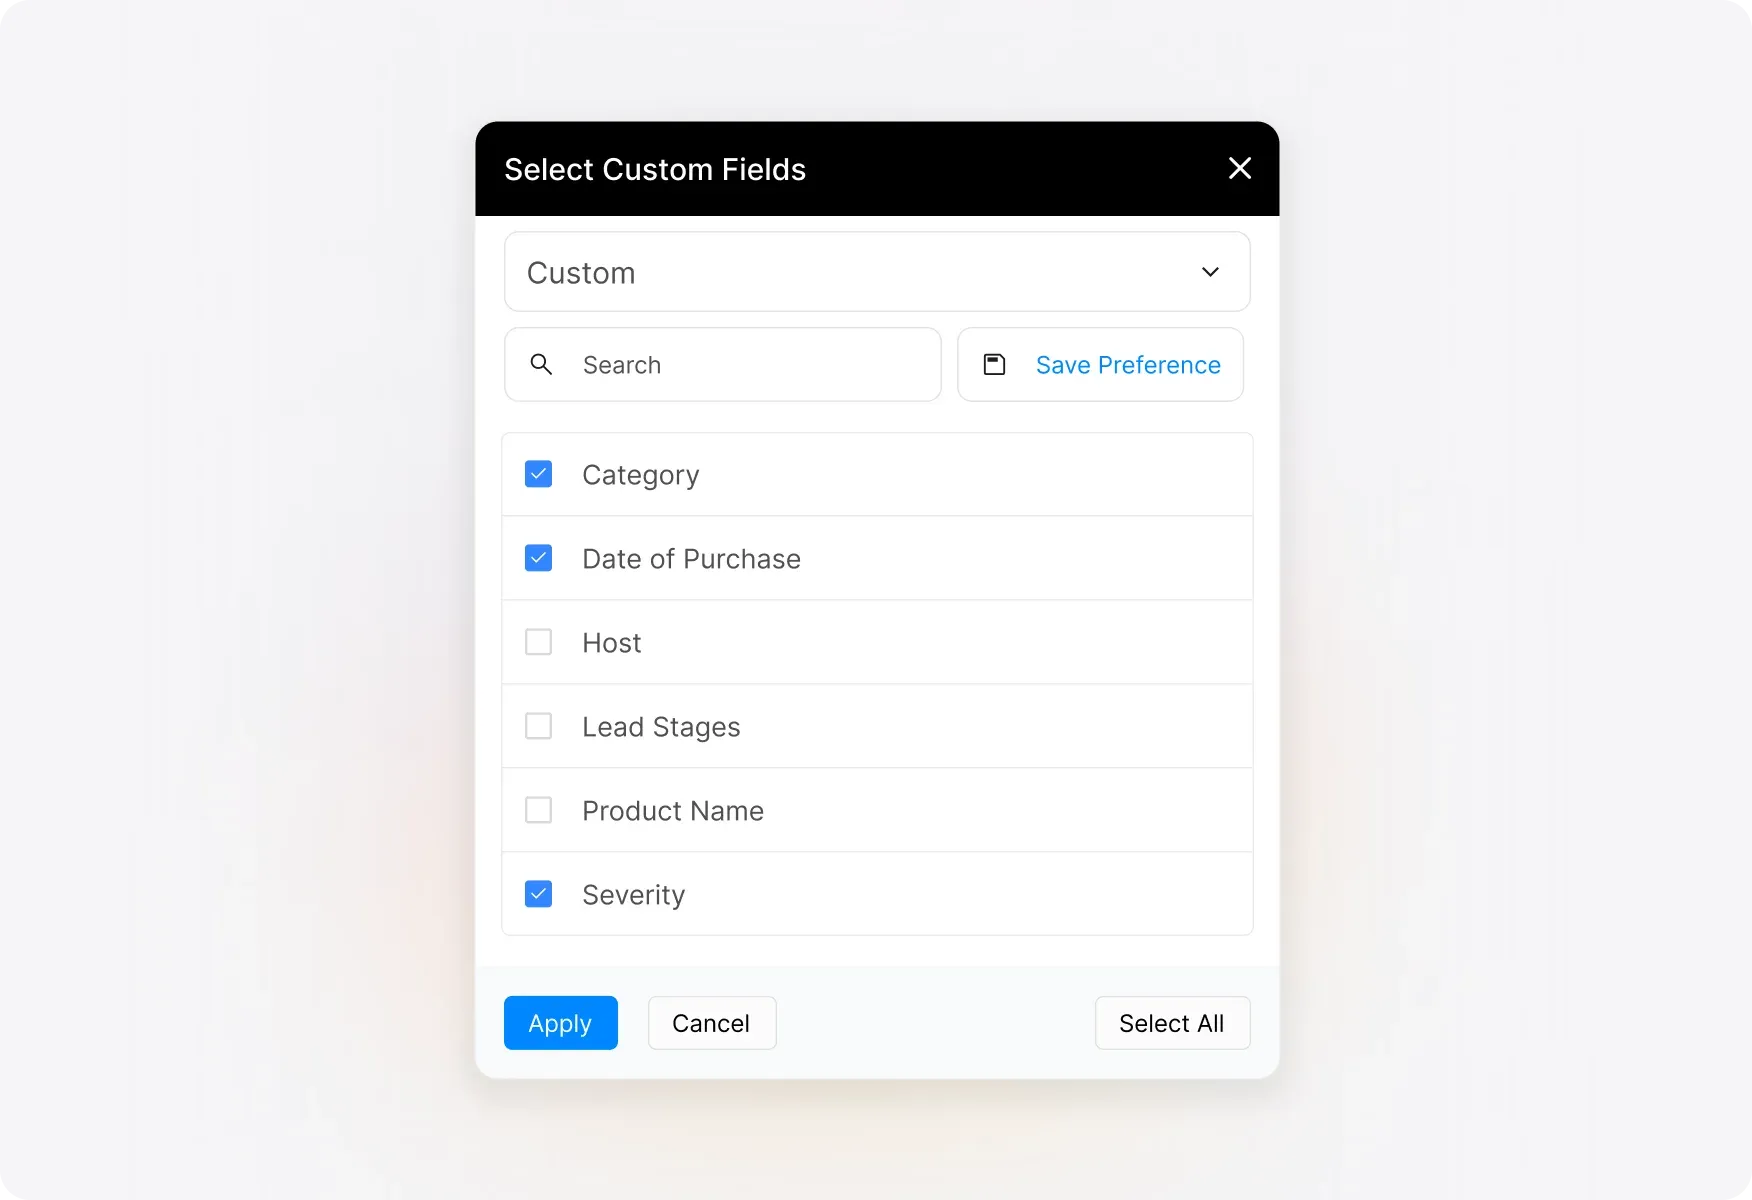
Select and Visualize Up to 20 Custom Fields
Choose the exact custom fields you want to analyze through the intuitive custom field selector. With support for up to 20 fields at once and a handy search bar for large field sets, you'll find what you need instantly.
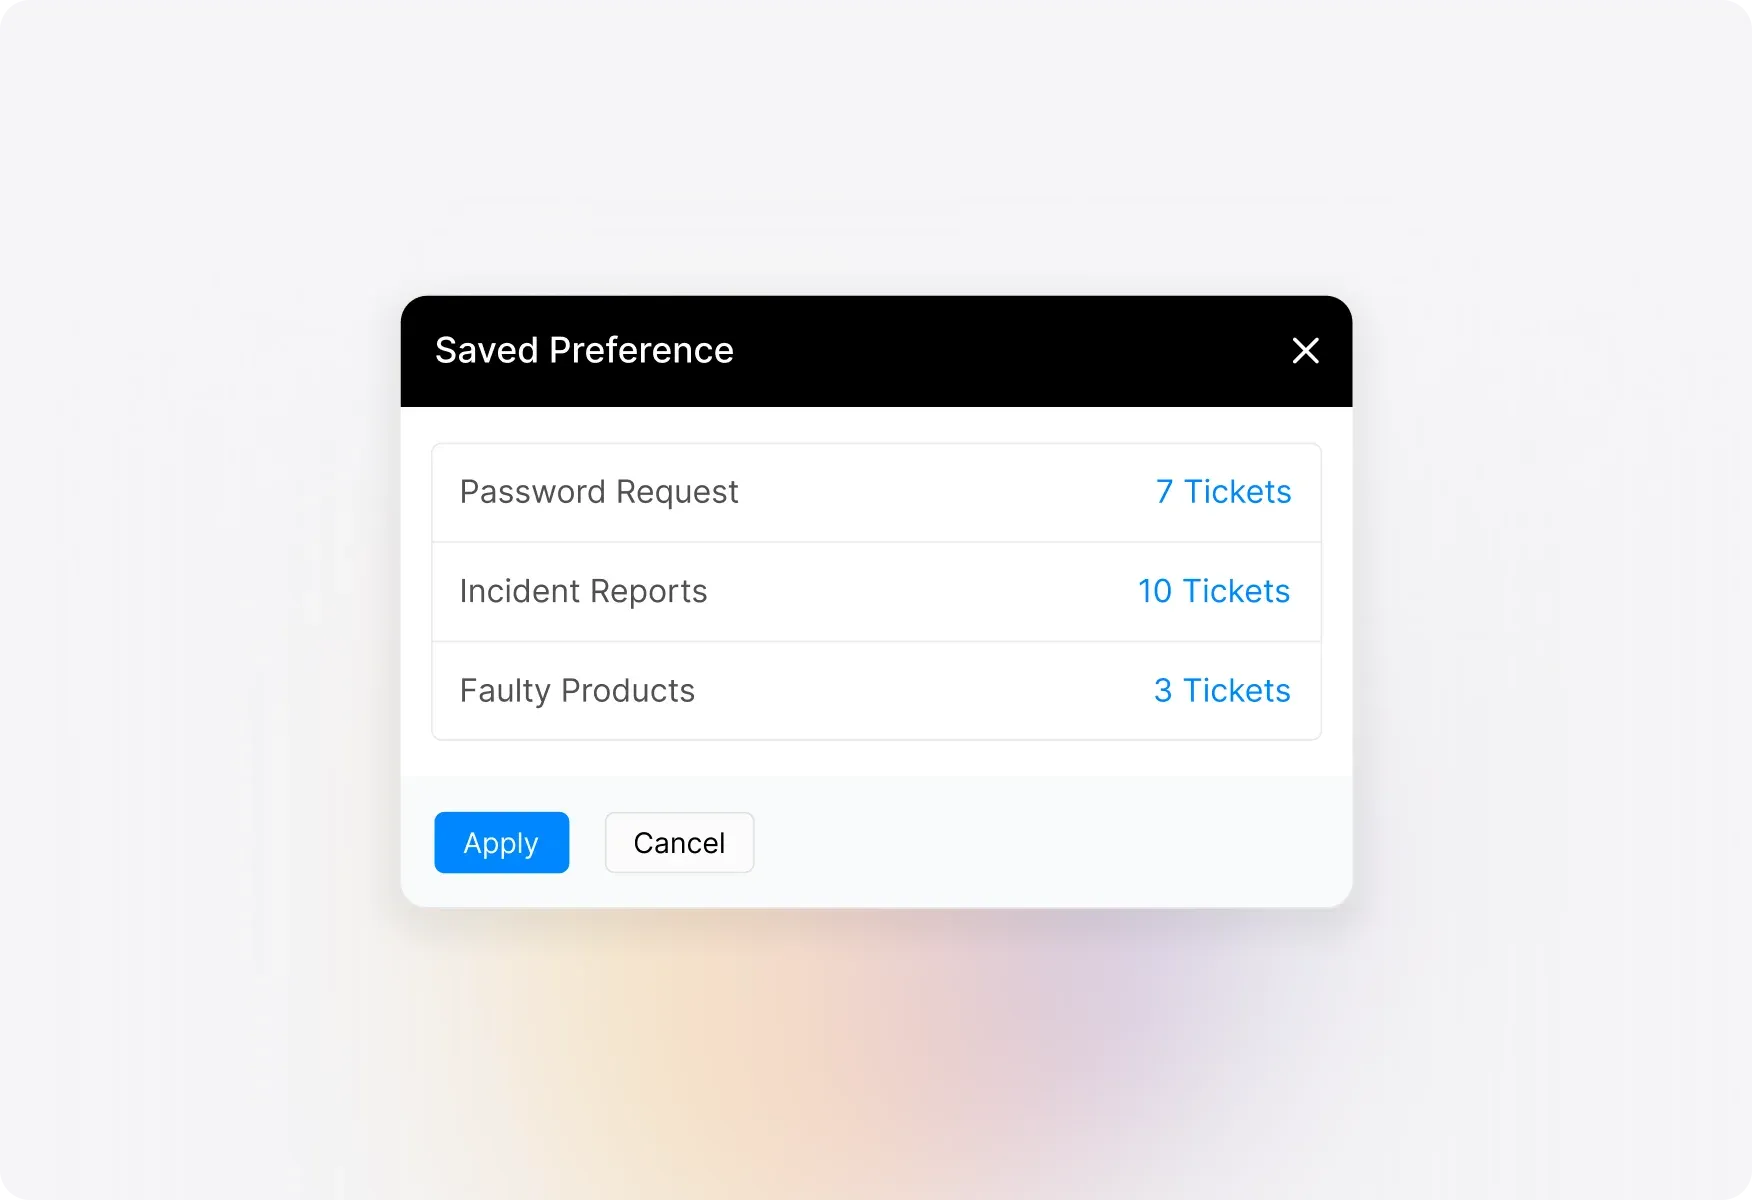
Save Preferences for Frequently Monitored Fields
Stop recreating the same reports over and over. Save your current selection of custom fields as a "Saved Preference" and access it anytime with a single click. Perfect for teams who regularly monitor specific groups of custom fields.
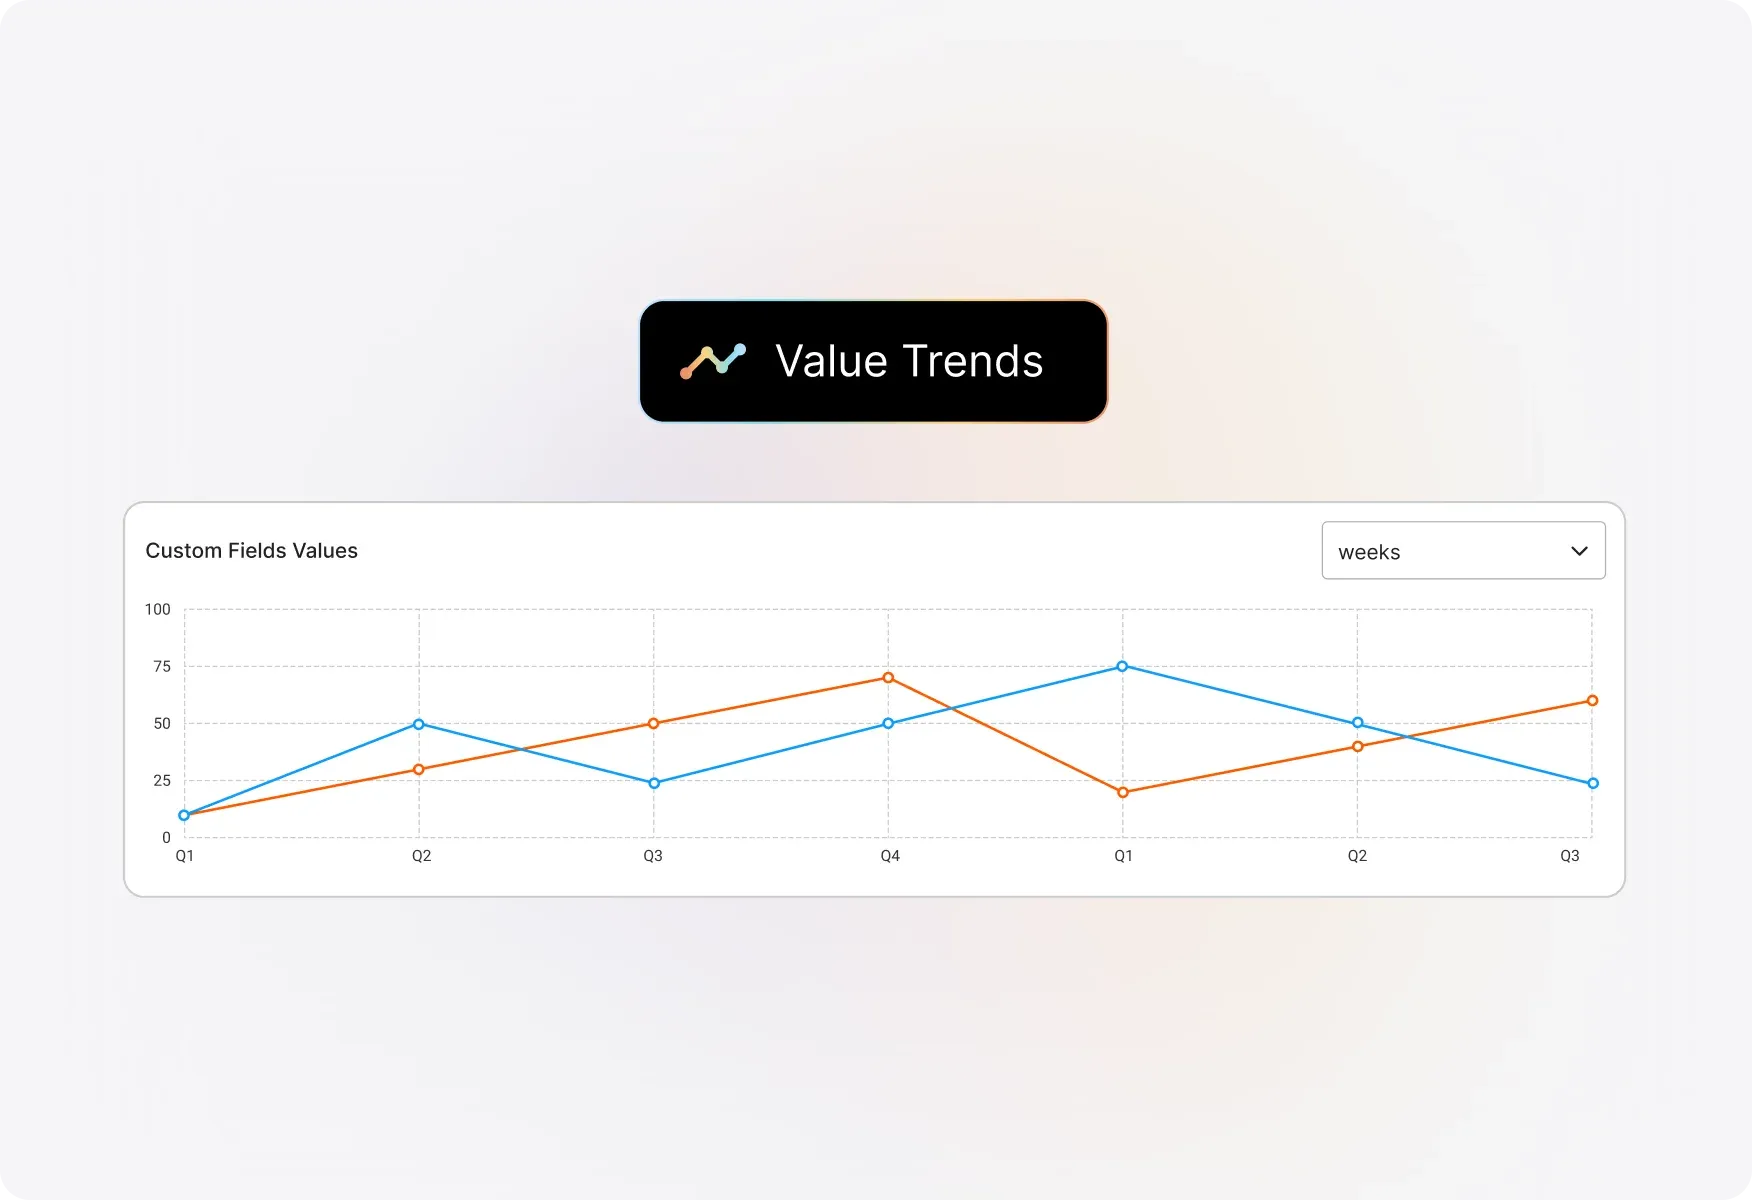
Visualize Trends with Timeline Widgets
Track how custom field values change over time with the always-present timeline widget. Choose from time-series line charts, heat maps, or tables to visualize ticket distribution across any time period.
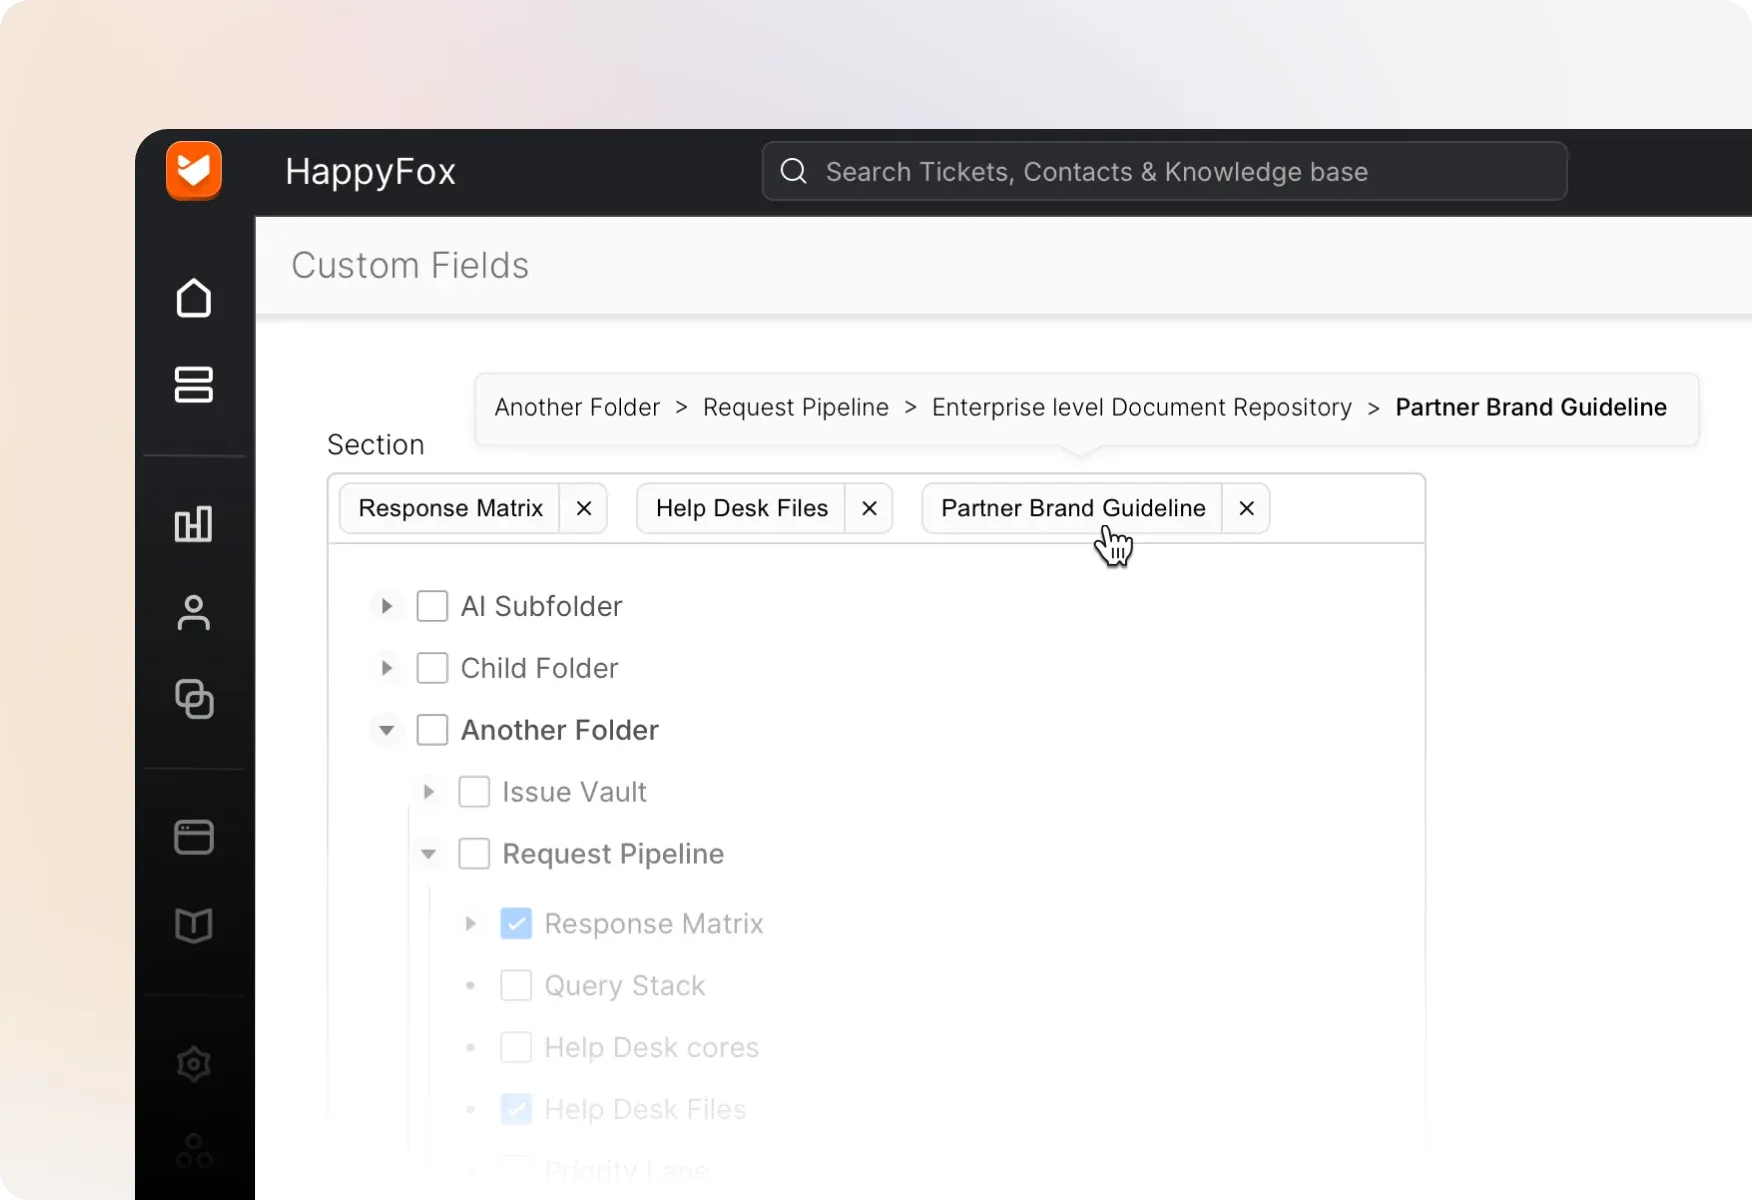
Understand Parent-Child Field Relationships
Working with hierarchical custom fields? Easily identify parent-child relationships right in the selector. Hover over any field to see its immediate parent and chosen value, keeping complex field structures crystal clear.
Explore Other HappyFox Features
FAQ's
Turn Custom Field Data into Actionable Insights
Stop guessing, start knowing. Visualize your custom field usage, track trends, and optimize your support operations with powerful reporting.

Use Cases
For Business Type
For Industries


Copyright ©2026 HappyFox Inc. All rights reserved.