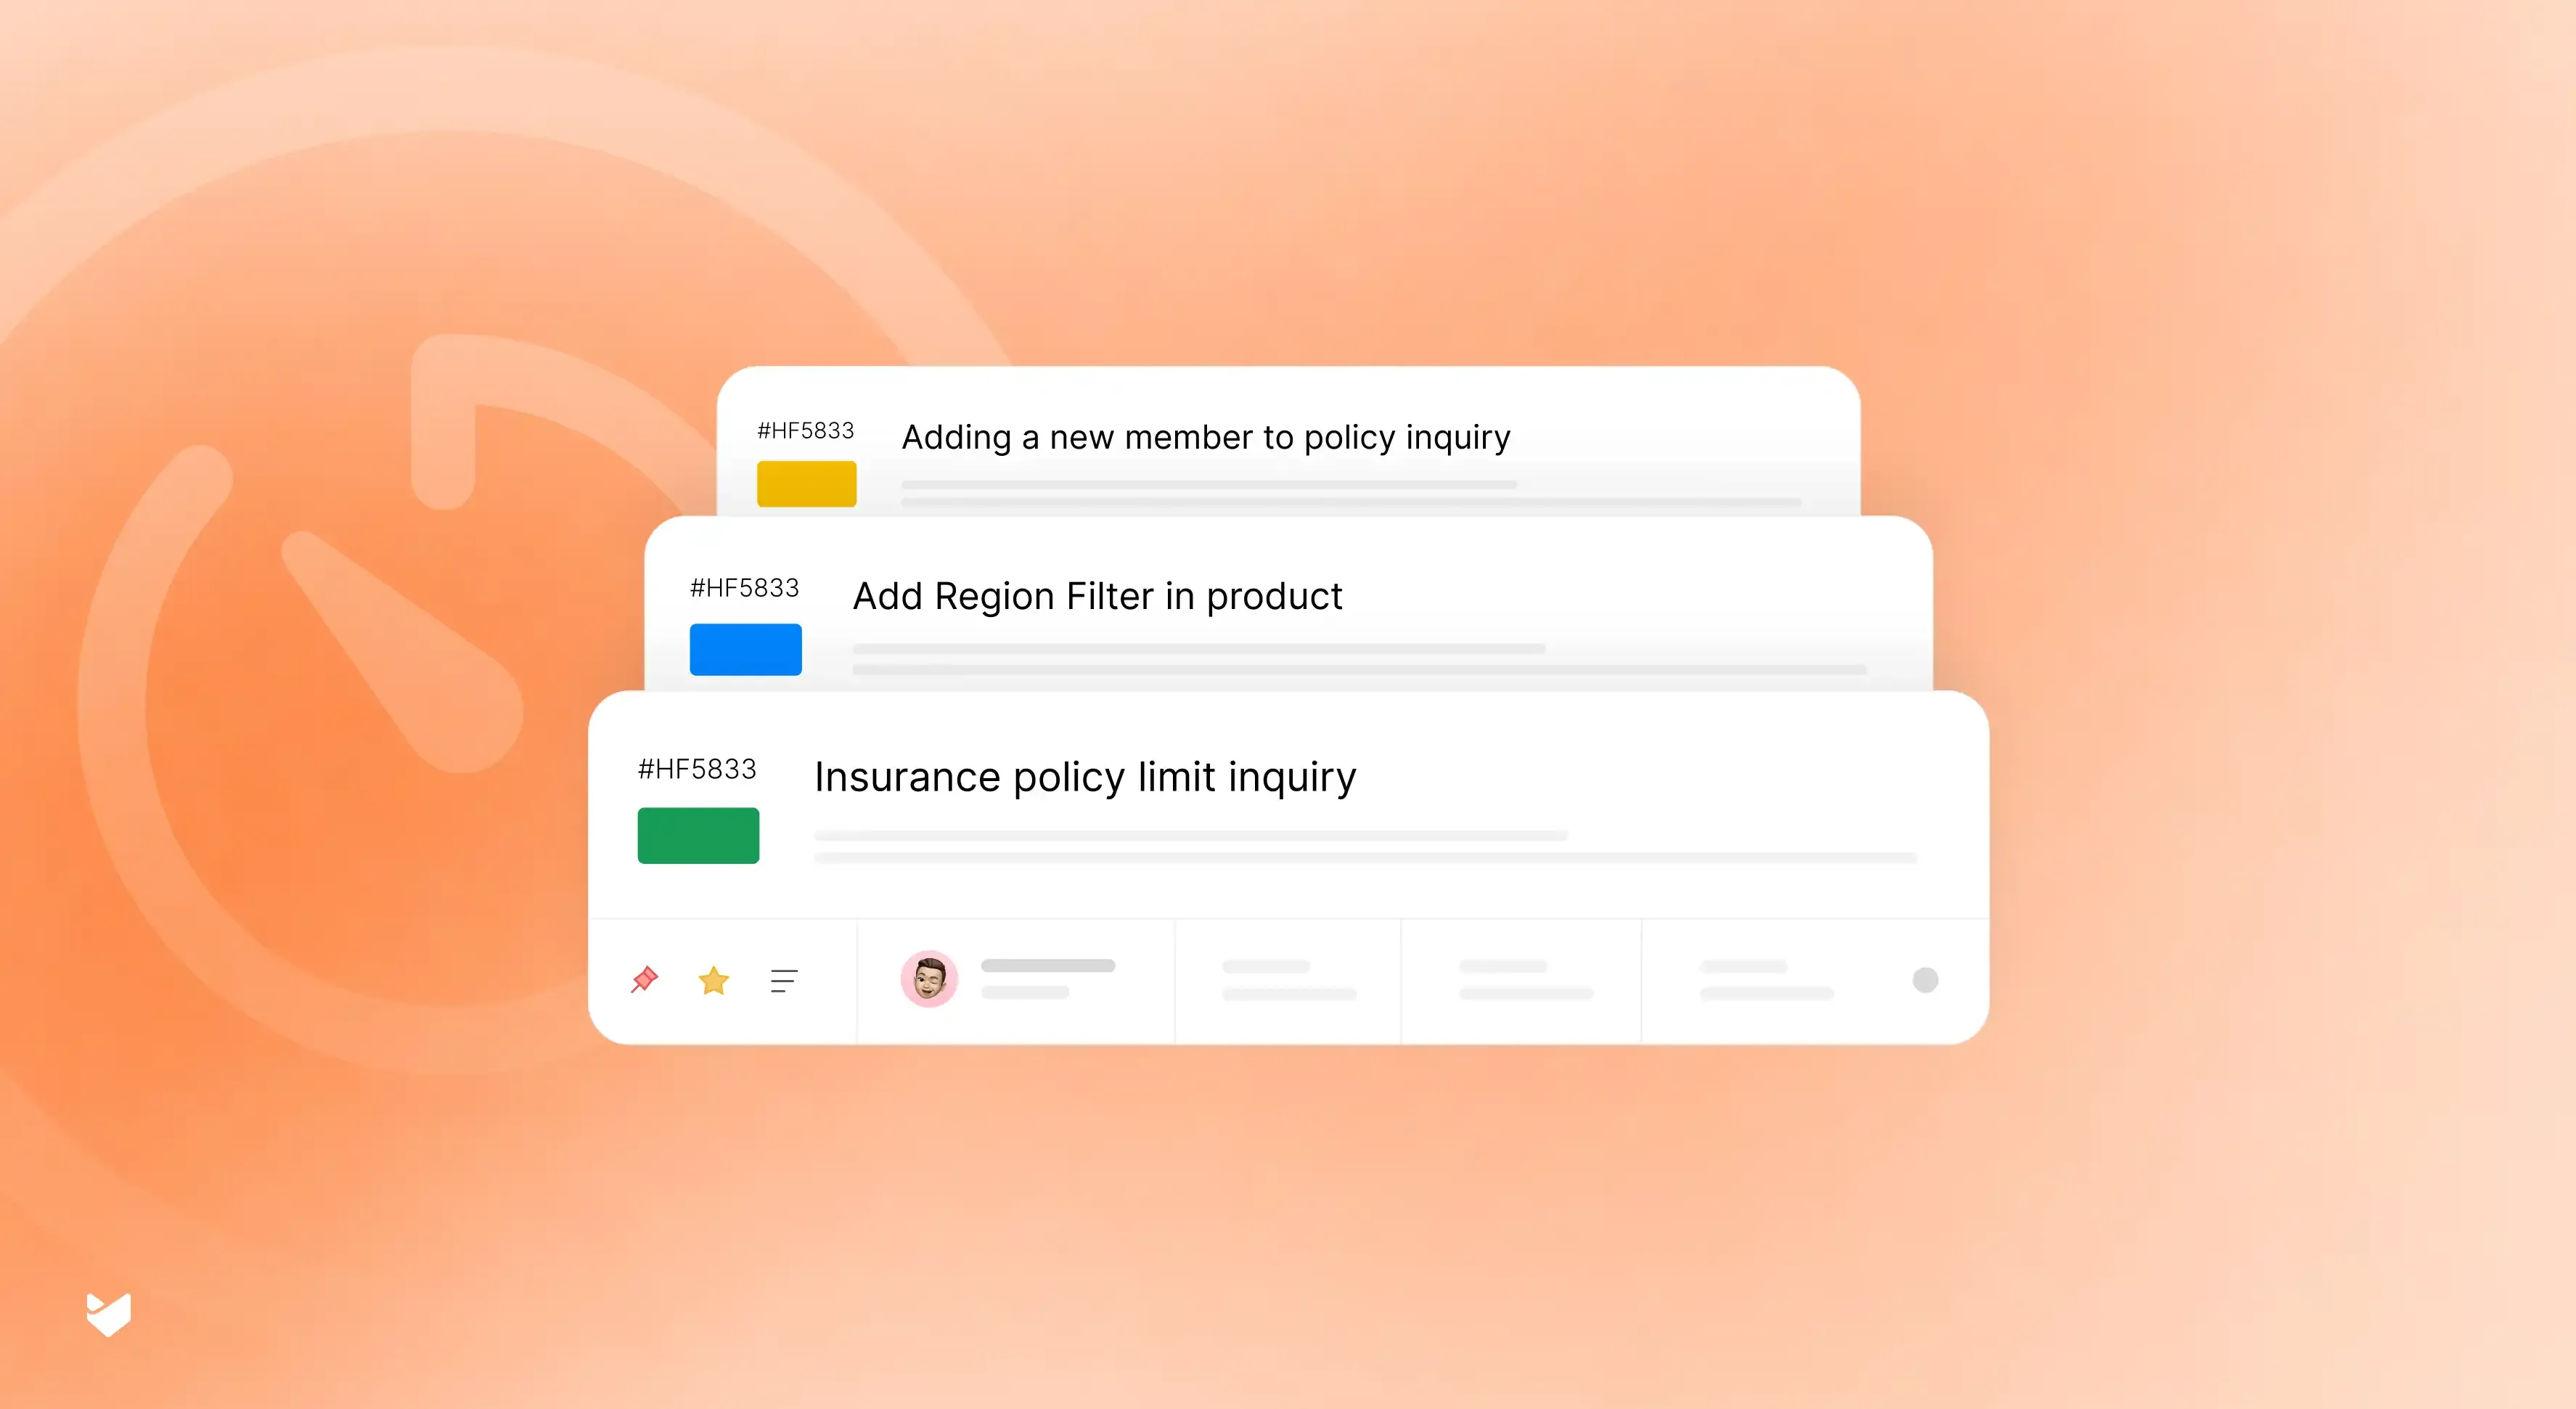
See Your Ticket Distribution at a Glance

Monitor real-time distribution of ticket status, priority, category, and assignee to spot trends, balance workloads, and optimize your support operations.
darwinbox Dartmouth Planned Parenthood_Customer Logo Pinewood School_Customer Logo loanlogics Medipulse North Country Healthcare_Customer Logo Whirlpool_Customer Logo Improved Racing_Customer Logo Slam_Customer Logo Sonny's BBQ_Customer Logo Minnnetronix_Customer Logo renoworks_Customer Logo darwinbox Dartmouth Planned Parenthood_Customer Logo Pinewood School_Customer Logo loanlogics Medipulse North Country Healthcare_Customer Logo Whirlpool_Customer Logo Improved Racing_Customer Logo Slam_Customer Logo Sonny's BBQ_Customer Logo Minnnetronix_Customer Logo renoworks_Customer Logo darwinbox Dartmouth Planned Parenthood_Customer Logo Pinewood School_Customer Logo loanlogics Medipulse North Country Healthcare_Customer Logo Whirlpool_Customer Logo Improved Racing_Customer Logo Slam_Customer Logo Sonny's BBQ_Customer Logo Minnnetronix_Customer Logo renoworks_Customer Logo

Flying Blind Without Ticket Distribution Insights?

When you can't see how tickets are distributed across your team, problems pile up fast. Overloaded agents burn out while others sit idle. High-priority tickets get buried. Categories overflow without anyone noticing until customers complain.

HappyFox Distribution Reports give you instant visibility into ticket patterns across status, priority, category, and assignee—so you can balance workloads, spot bottlenecks, and keep your support running smoothly.

What Are Distribution Reports in HappyFox?
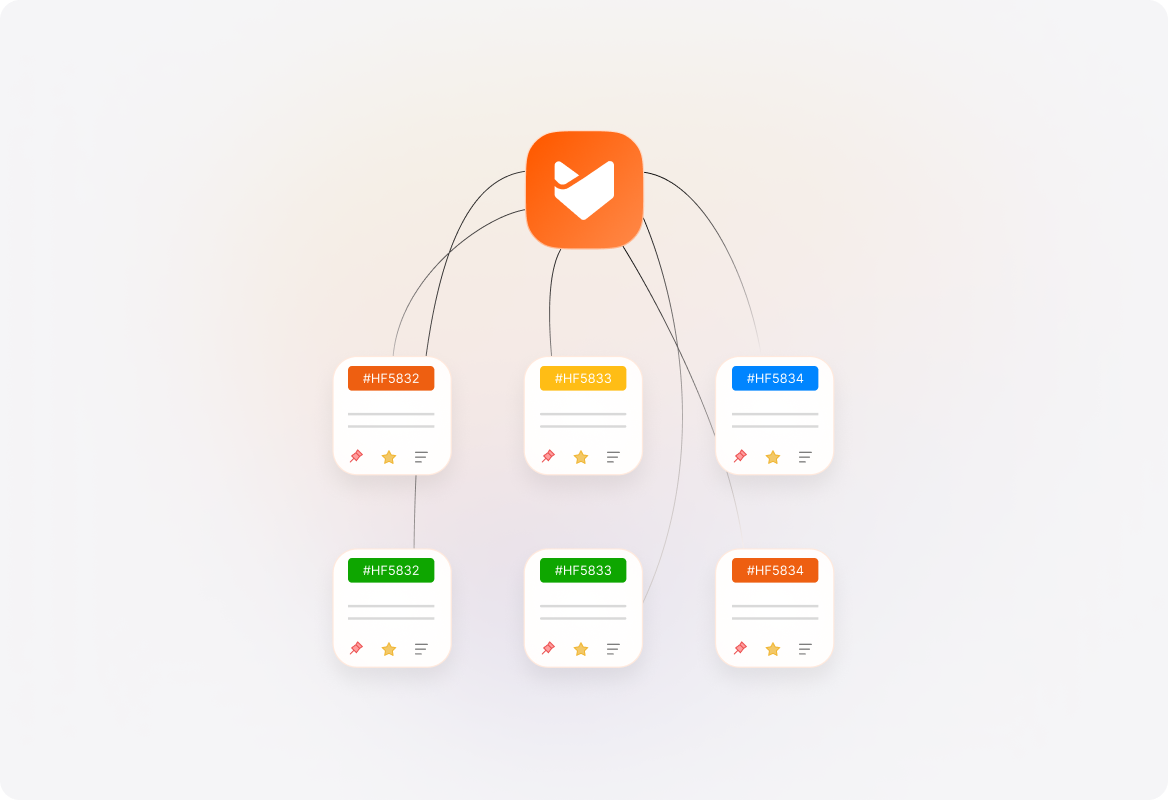
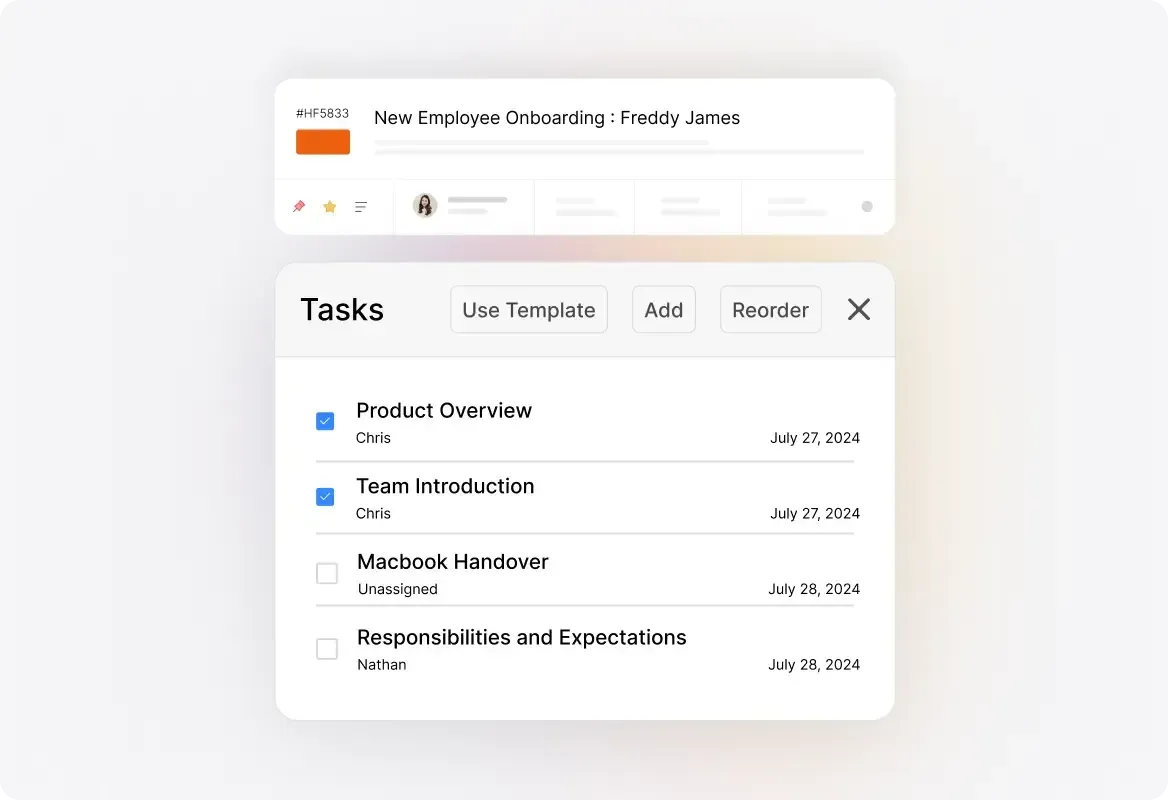
Distribution Reports provide real-time visualizations of how tickets are spread across key properties—helping managers identify patterns, balance workloads, and make data-driven decisions.

Real-Time

Ticket Visibility

See current ticket distribution across status, priority, category, and assignee instantly.

200+

Assignees Tracked

View distribution across up to 200 assignees with quick search functionality.
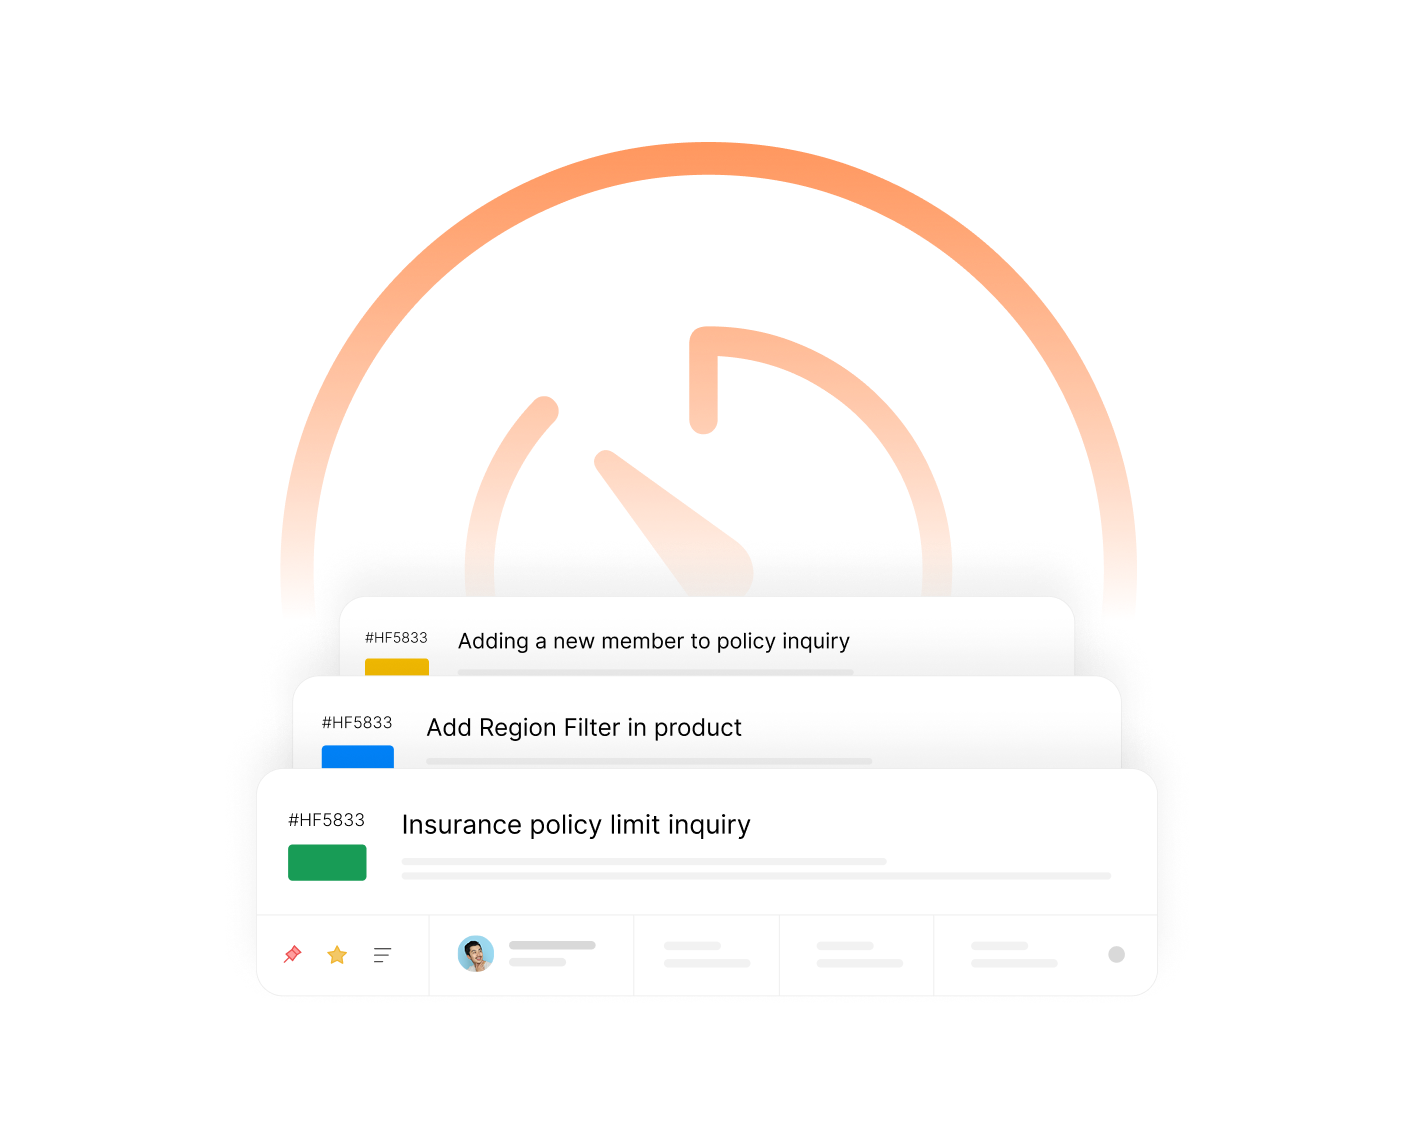
100%

Trend Analysis

Track status, priority, and category distribution across ticket creation over time.

Distribution Insights That Turn Data into Action

Summary Pane—Your Ticket Snapshot

Get a quick overview of your ticket distribution with at-a-glance statistics. See which status, category, priority, and assignee have the most tickets—instantly identifying where attention is needed most.

Distribution by Assignee

Visualize how tickets are distributed across your team. See which agents are overloaded and who has capacity—with support for up to 200 assignees and quick search to find specific team members.

Distribution by Category

Understand ticket volume across different categories in your help desk. Filter by specific categories to focus on what matters most and identify which areas need more resources.

Distribution by Priority & Status

Track how tickets are spread across priority levels and statuses. Spot bottlenecks where high-priority tickets are piling up or statuses that indicate workflow issues.

Popular Tags Overview

See the top ten most-used tags across your tickets at a glance. Identify trending issues and common themes to proactively address recurring problems.

Time-Based Distribution Analysis

Visualize how status, priority, and category distribution changes over time based on ticket creation. Track trends to understand patterns and plan resources accordingly.

Frequently Asked Questions

How do I access Distribution Reports?
arrow
Navigate to Reports >> Distribution from the module switcher in your HappyFox dashboard. Distribution Reports are available on all pricing plans.
What filters can I apply to Distribution Reports?
arrow
You can filter by categories, ticket activity type (creation or update), and time period. The report statistics will populate based on tickets matching your selected filters.
What's the difference between Ticket Creation and Ticket Update filters?
arrow
Ticket Creation filters show tickets created during your selected time period, while Ticket Update filters show tickets that had any activity or updates during that time.
How many assignees can I view in the distribution report?
arrow
The assignee widget displays up to 200 assignees. You can use the search functionality to quickly find specific agents or team members.
Does the report show historical data or current ticket state?
arrow
Distribution Reports show the current state of tickets—the ticket's current assignee, category, priority, and status are used when calculating metrics.

See the Full Picture. Optimize Your Support.

Stop guessing where your tickets are going—get real-time distribution insights to balance workloads and accelerate resolutions.

footer-banner-image