


Track Agent Performance and Boost Team Productivity
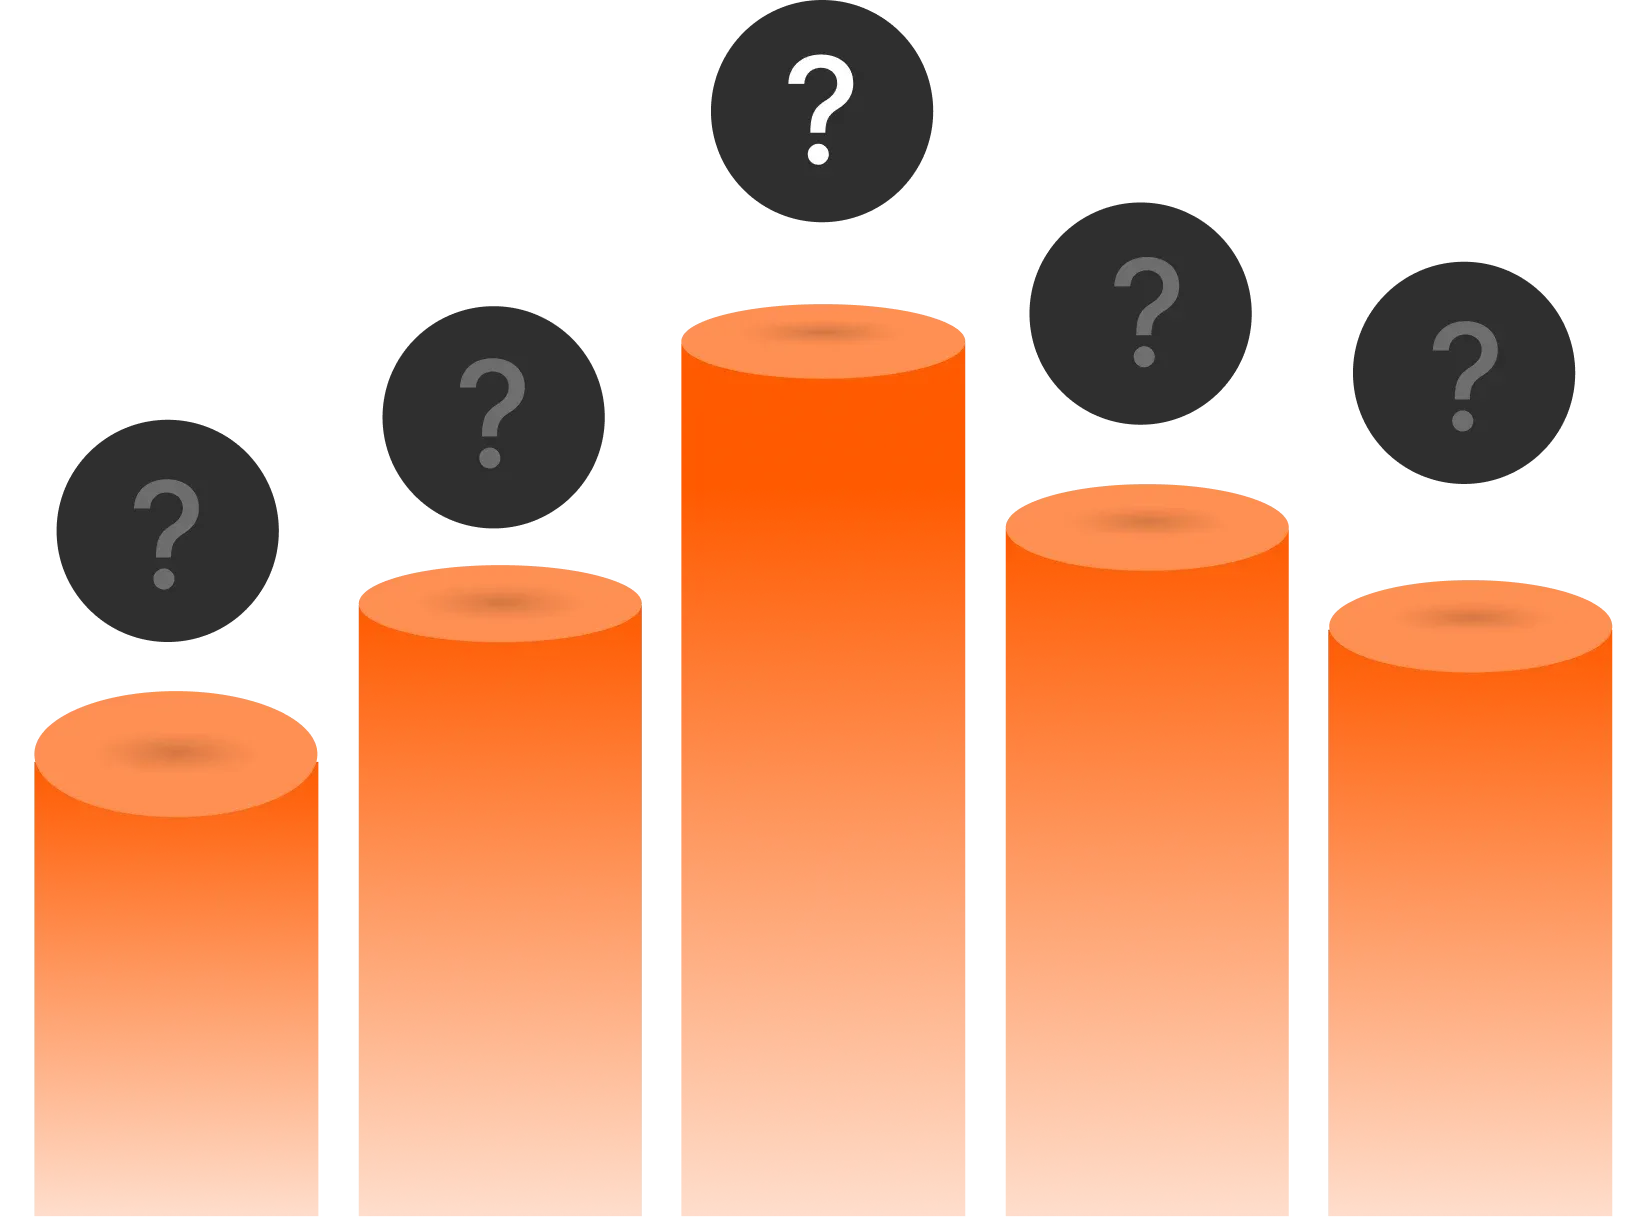


Managing Agent Performance Without Clear Data is a Guessing Game
Without visibility into agent activities, support managers struggle to identify who's excelling, who needs coaching, and where bottlenecks exist. Manual tracking is time-consuming and prone to errors, leaving teams without the insights they need to improve.
HappyFox's Agent Activity Report gives you instant access to key productivity metrics like ticket closures, replies added, notes created, and overall participation. No more guesswork. Just clear, actionable data to drive team performance.
What Does the Agent Activity Report Measure?
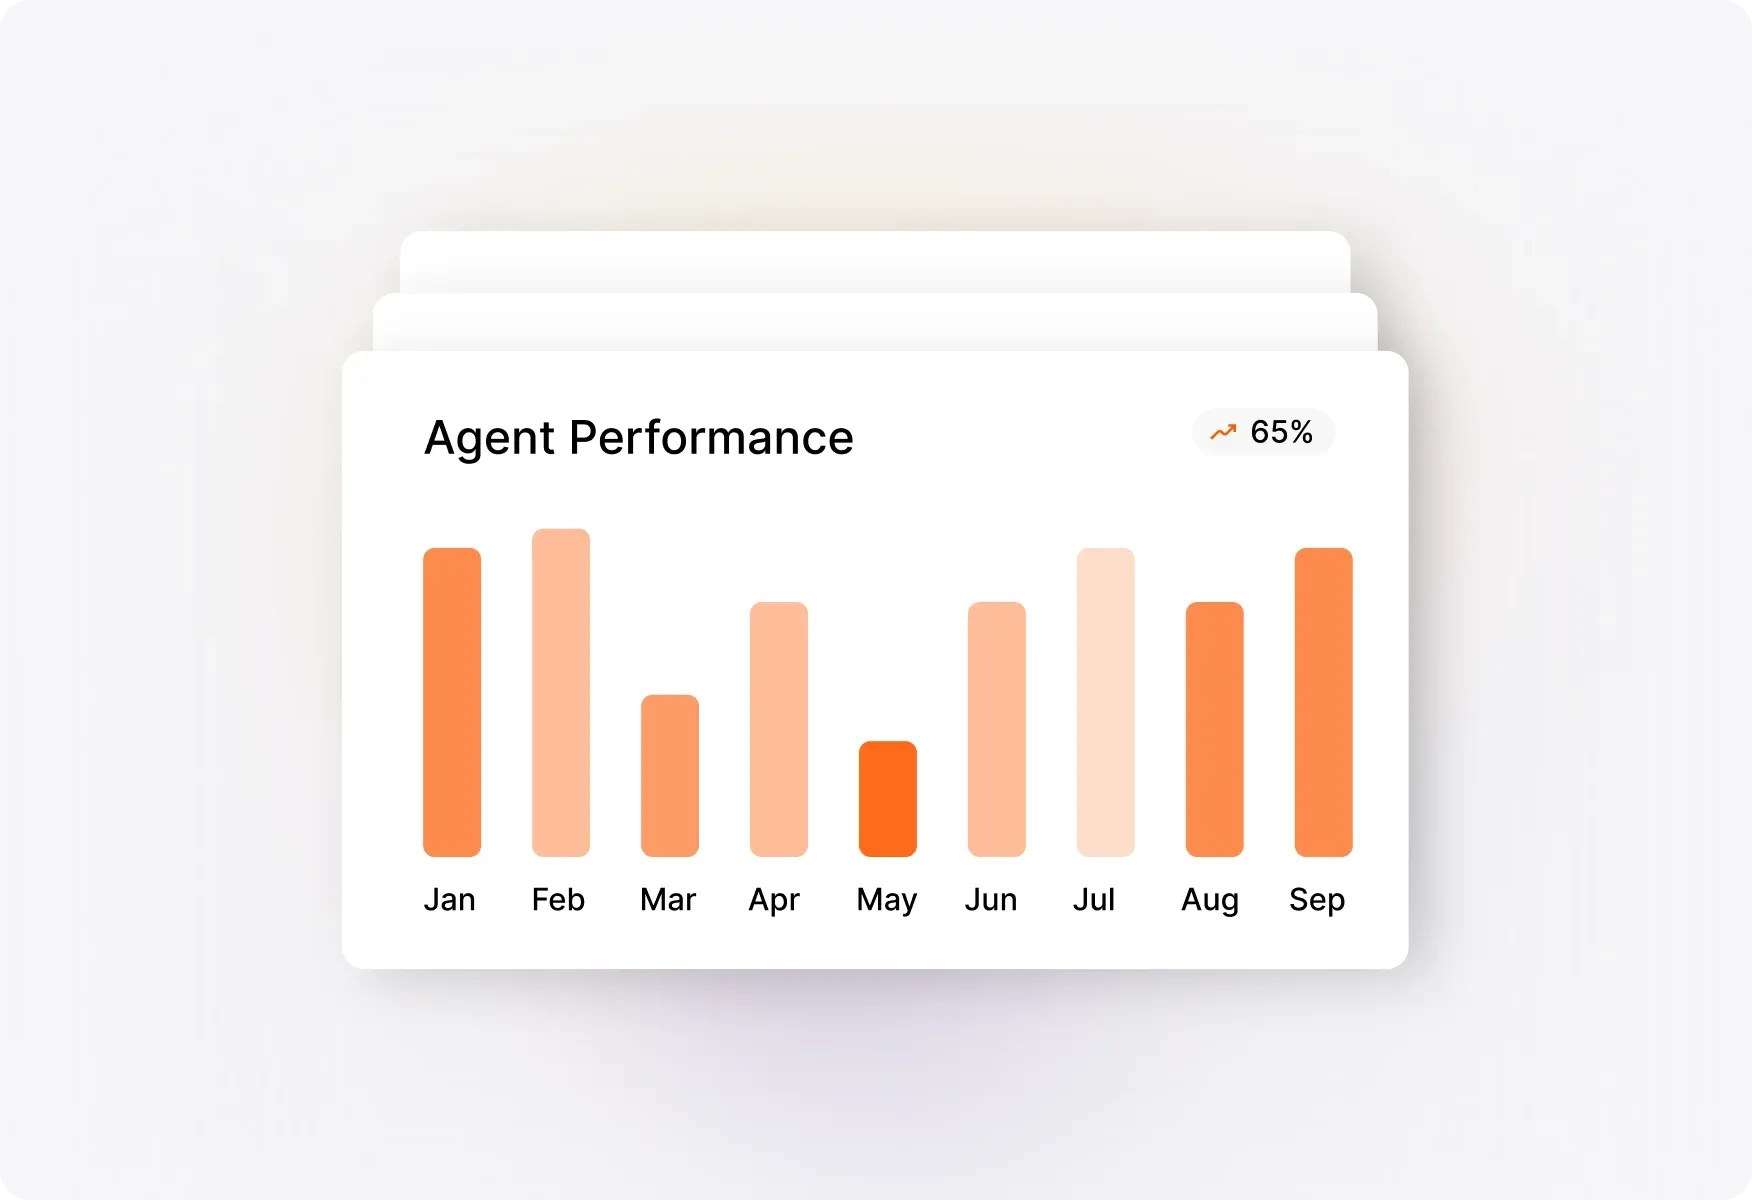
The Agent Activity Report measures the competence of agents across your helpdesk, helping you track your team's productivity through the actions they perform while addressing support queries.
Maximum
Ticket Closures
See which agent closed the most tickets in any given period
100%
Activity Visibility
Monitor notes added, ticket participation, and replies without notifications
Maximum
Replies Added
Track who's most responsive to customer queries
Powerful Insights to Understand Your Team's Performance
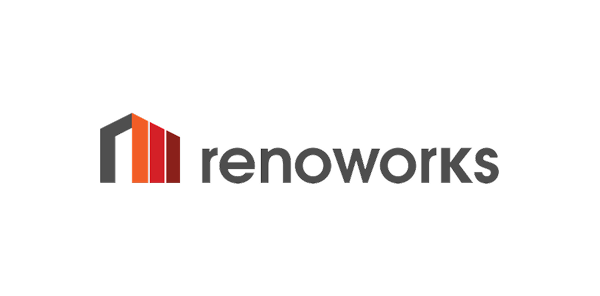
Summary Pane for Quick Insights
Get a snapshot of key agent activity statistics at a glance. The summary pane displays maximum ticket closures, replies added, notes added, and ticket participation—each showing the top-performing agent's name alongside their count.
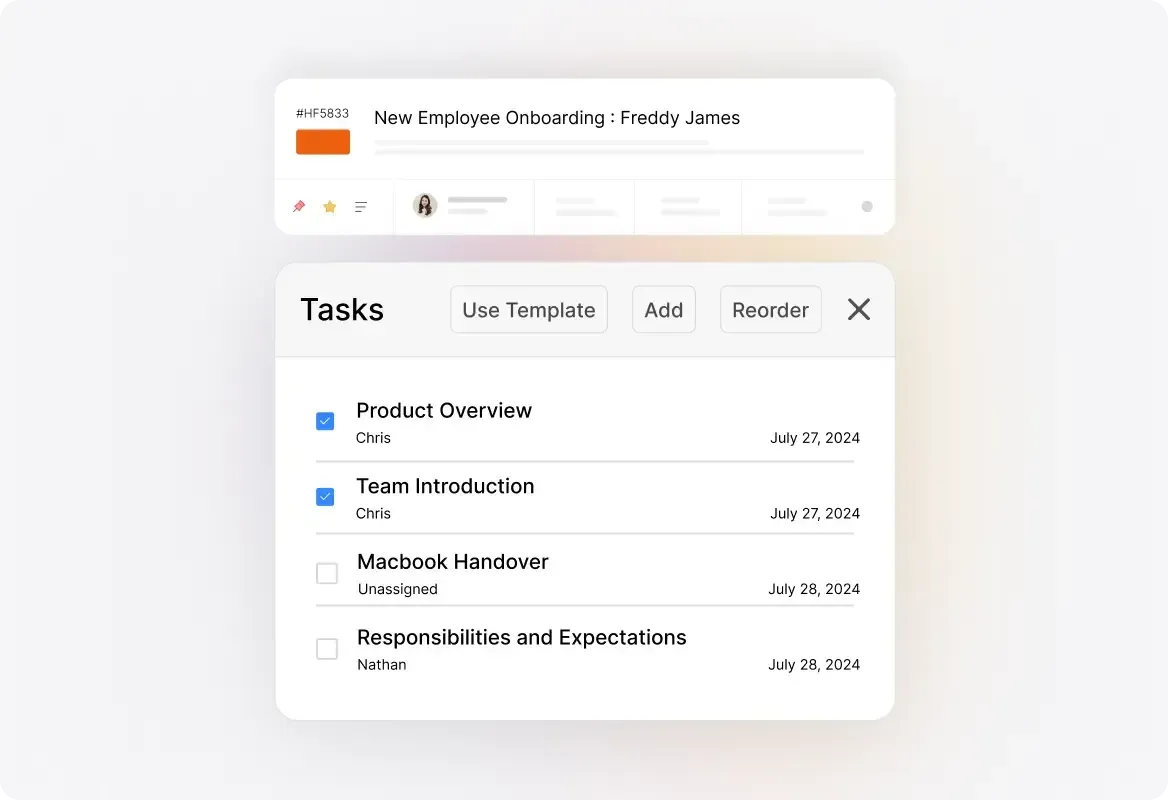
Agent Leaderboard to Identify Top Performers
Instantly identify your high performers and those who may need additional support. The agent leaderboard ranks all agents by their activity count for any selected time period, making performance reviews data-driven and fair.

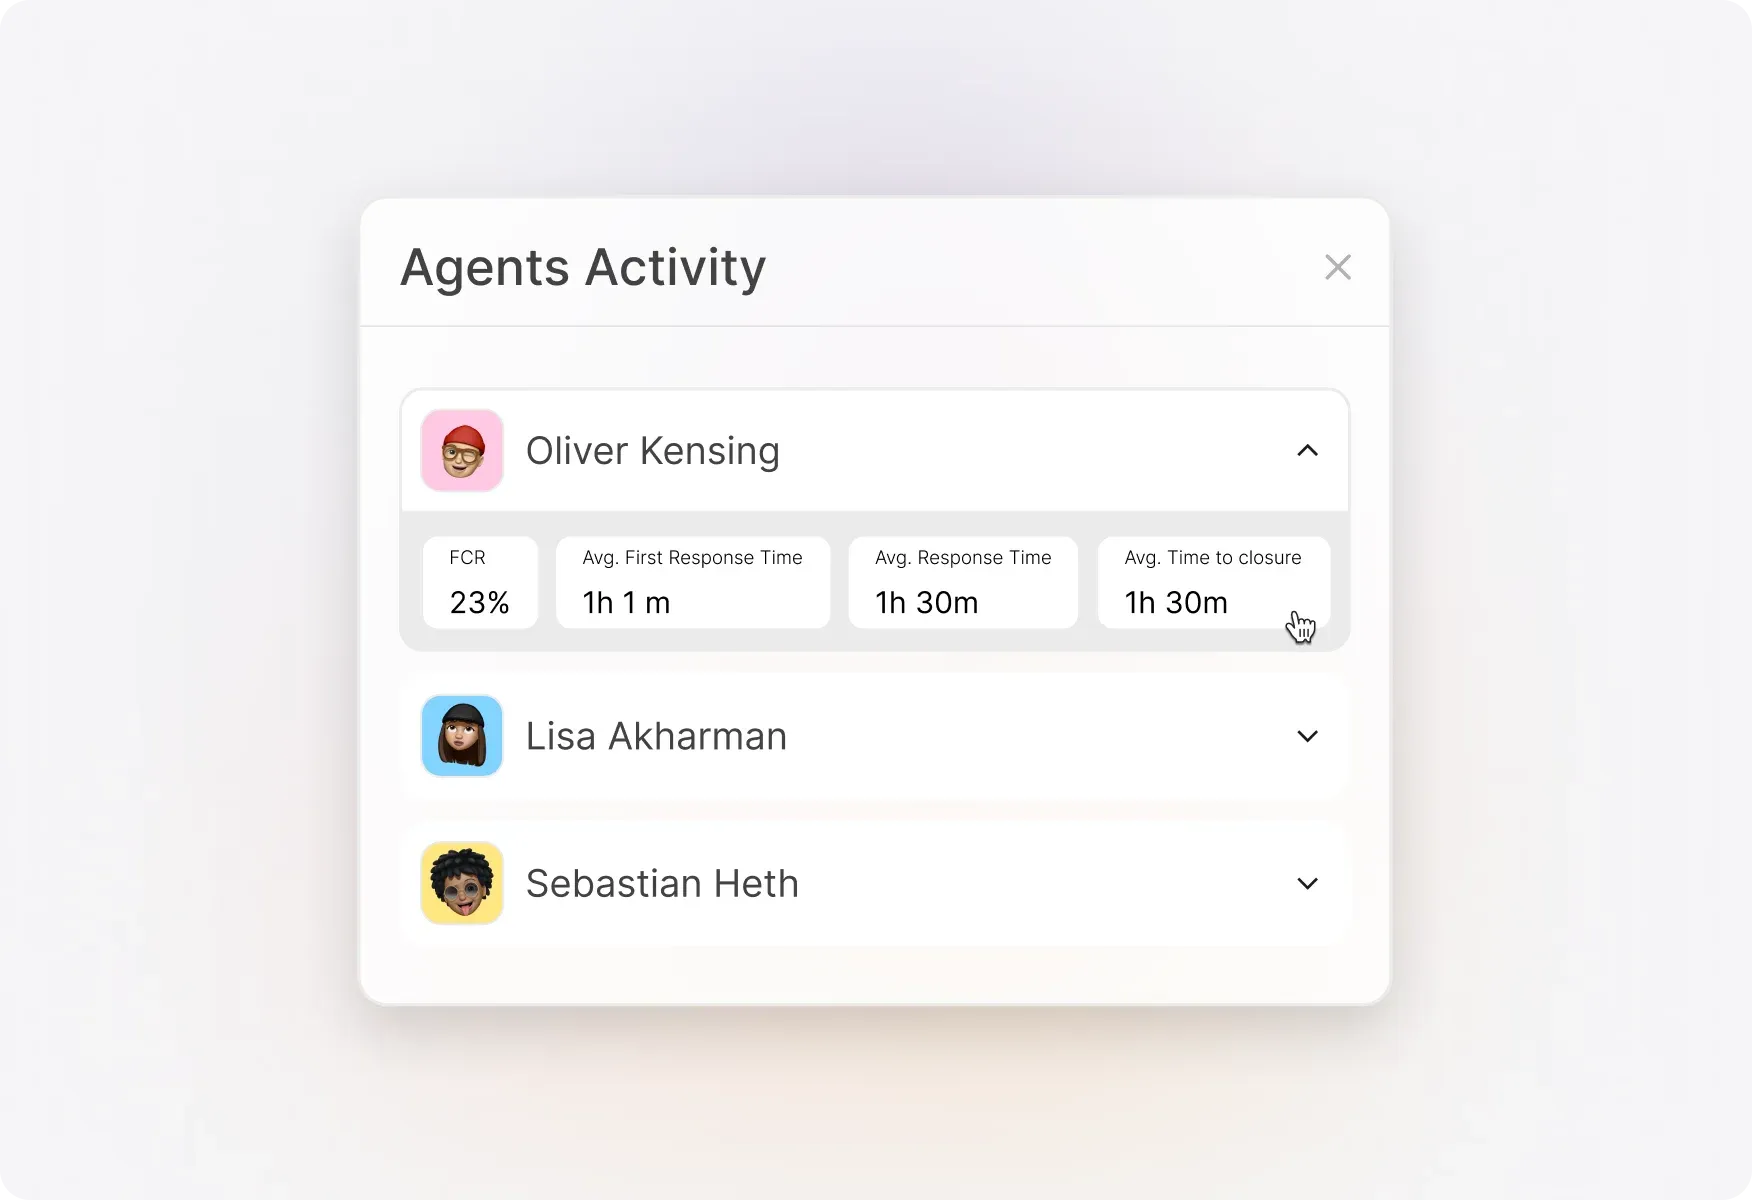
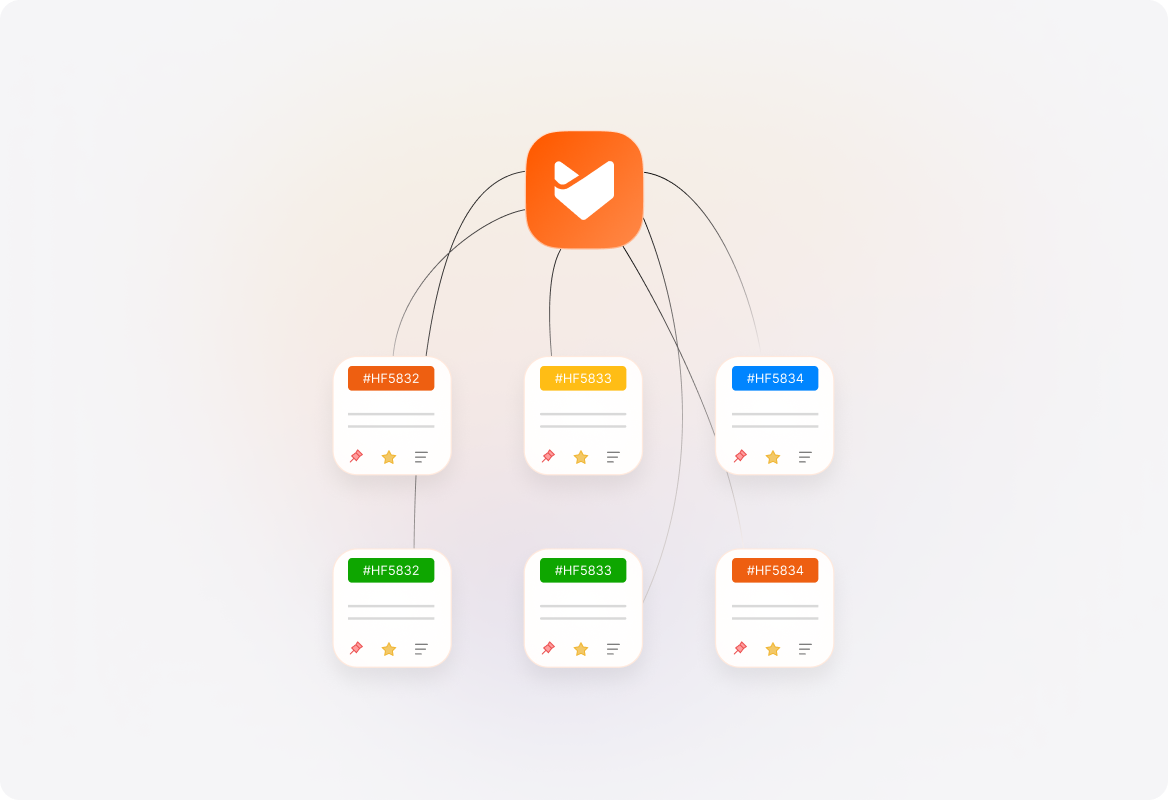
Agent Distribution Over Activities
Get a two-dimensional view of each activity performed against each agent. This widget helps you understand how work is distributed across your team and spot imbalances before they become problems.
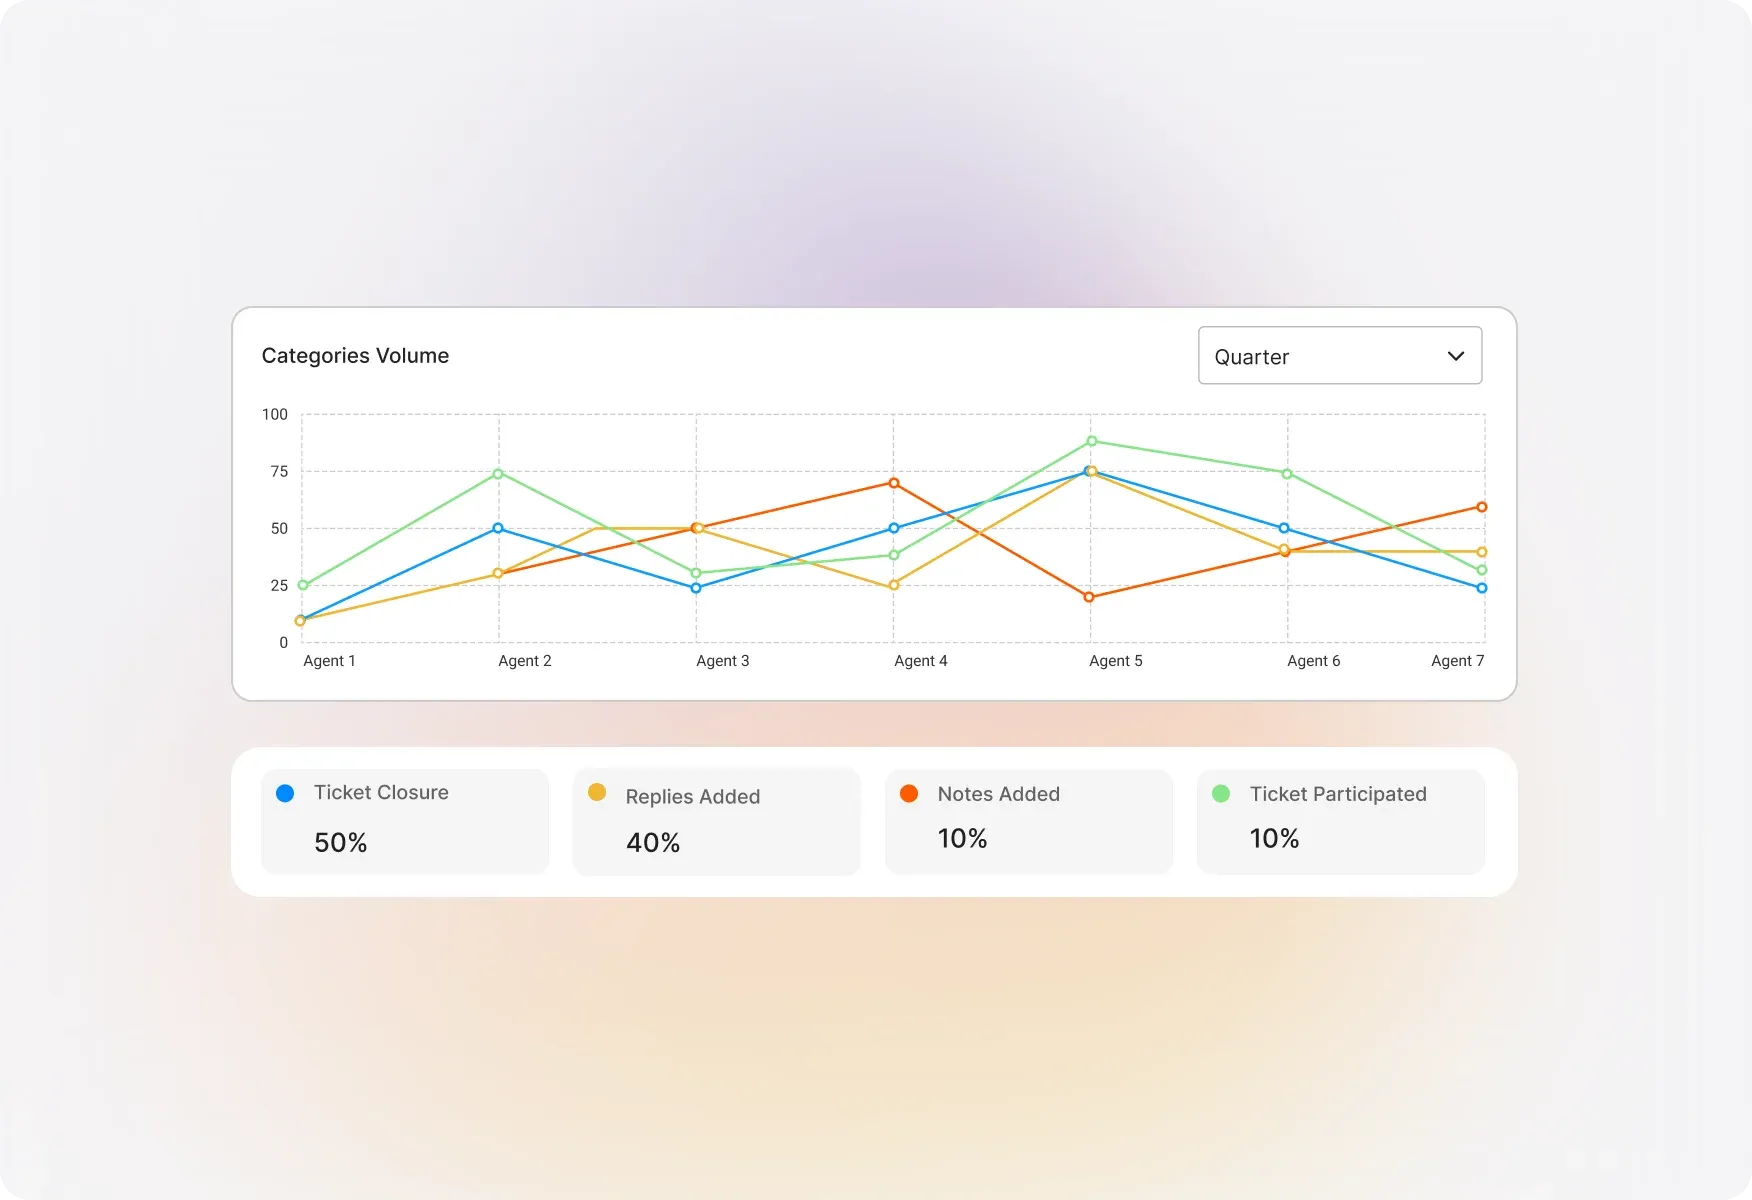
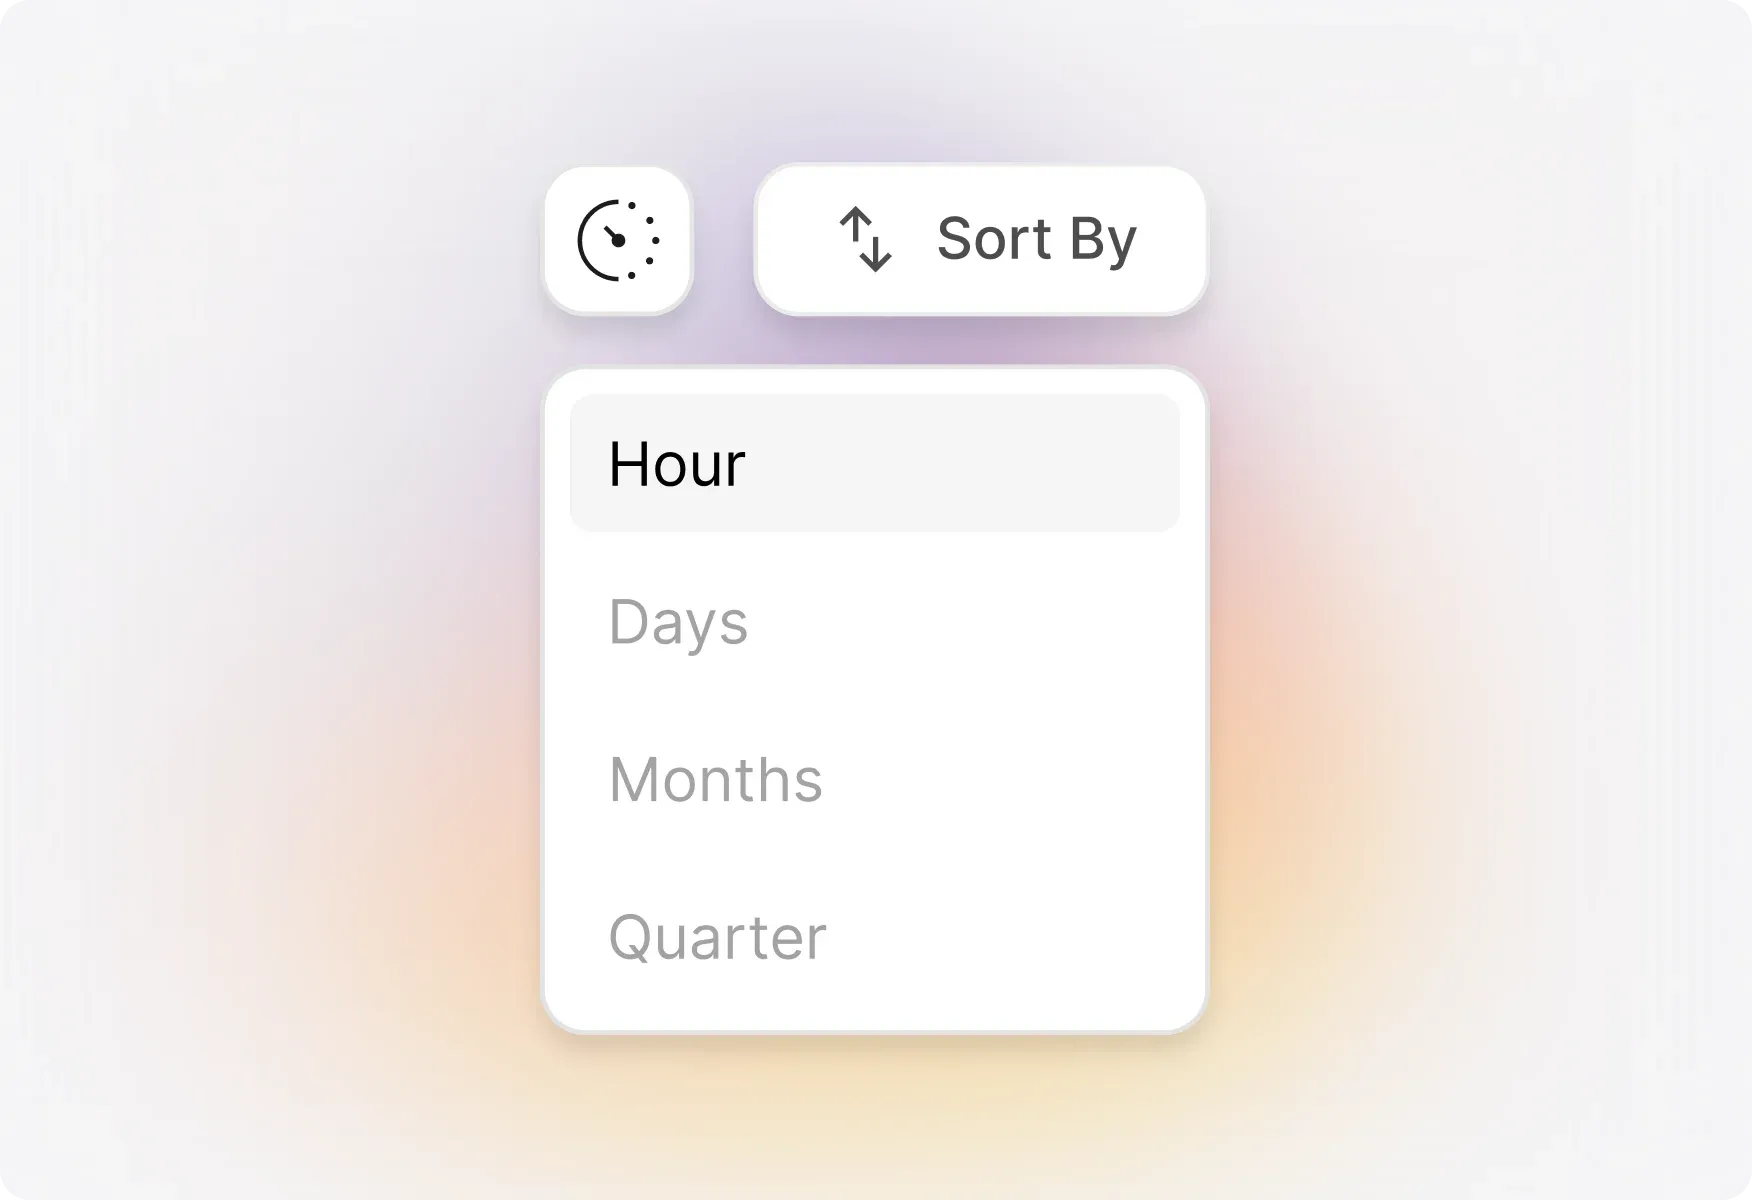
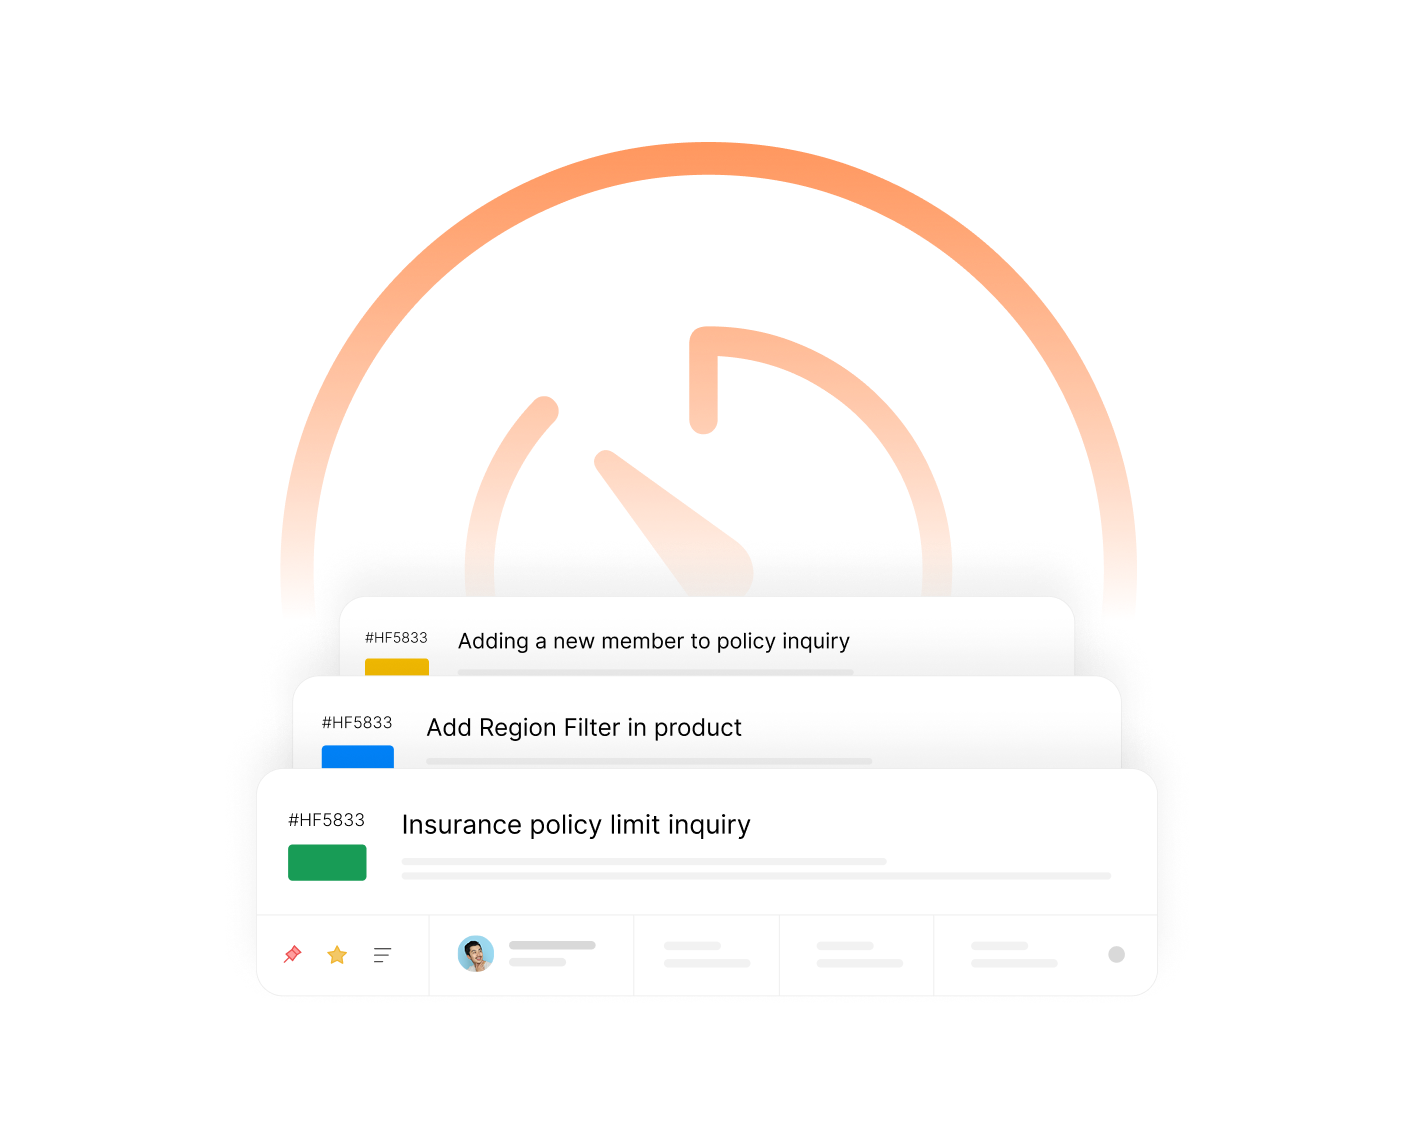
Count of Activities Across Time
Visualize how ticket closures, replies, notes, and participation trend over time. Refine your view by hour, day, month, quarter, or year to spot patterns and plan staffing accordingly.
Activity by Agents Across Time
Track how individual agents perform specific activities over time. Choose from timeline tables, heatmaps, or line graphs to visualize the data in the format that works best for you.
Explore Other HappyFox Reporting Features
Frequently Asked Questions
Turn Agent Data into Actionable Insights
Stop guessing about team performance. Get clear visibility into agent activities and make data-driven decisions to boost productivity.

Use Cases
For Business Type
For Industries


Copyright ©2026 HappyFox Inc. All rights reserved.