


Turn Support Data into Actionable Insights


Flying Blind Without Proper Support Analytics?
Without clear reporting, support managers struggle to identify bottlenecks, track SLA compliance, and measure team performance. Decisions get made on gut feeling instead of data, leading to missed targets and frustrated customers.
HappyFox Reports gives you a complete view of your help desk operations—from ticket distribution and response times to staff performance and customer activity. Make data-driven decisions that actually move the needle.
What Can HappyFox Reports Do For You?
100%
Ticket Visibility
See every ticket's status, priority, assignee, and category at a glance with the Overview section.
Real-time
SLA Tracking
Monitor SLA triggers, targets, and achievements to ensure you're meeting customer commitments.
Custom
Export Options
Export reports to CSV/Excel with customizable fields for deeper analysis and custom reporting.
Reports That Give You the Full Picture
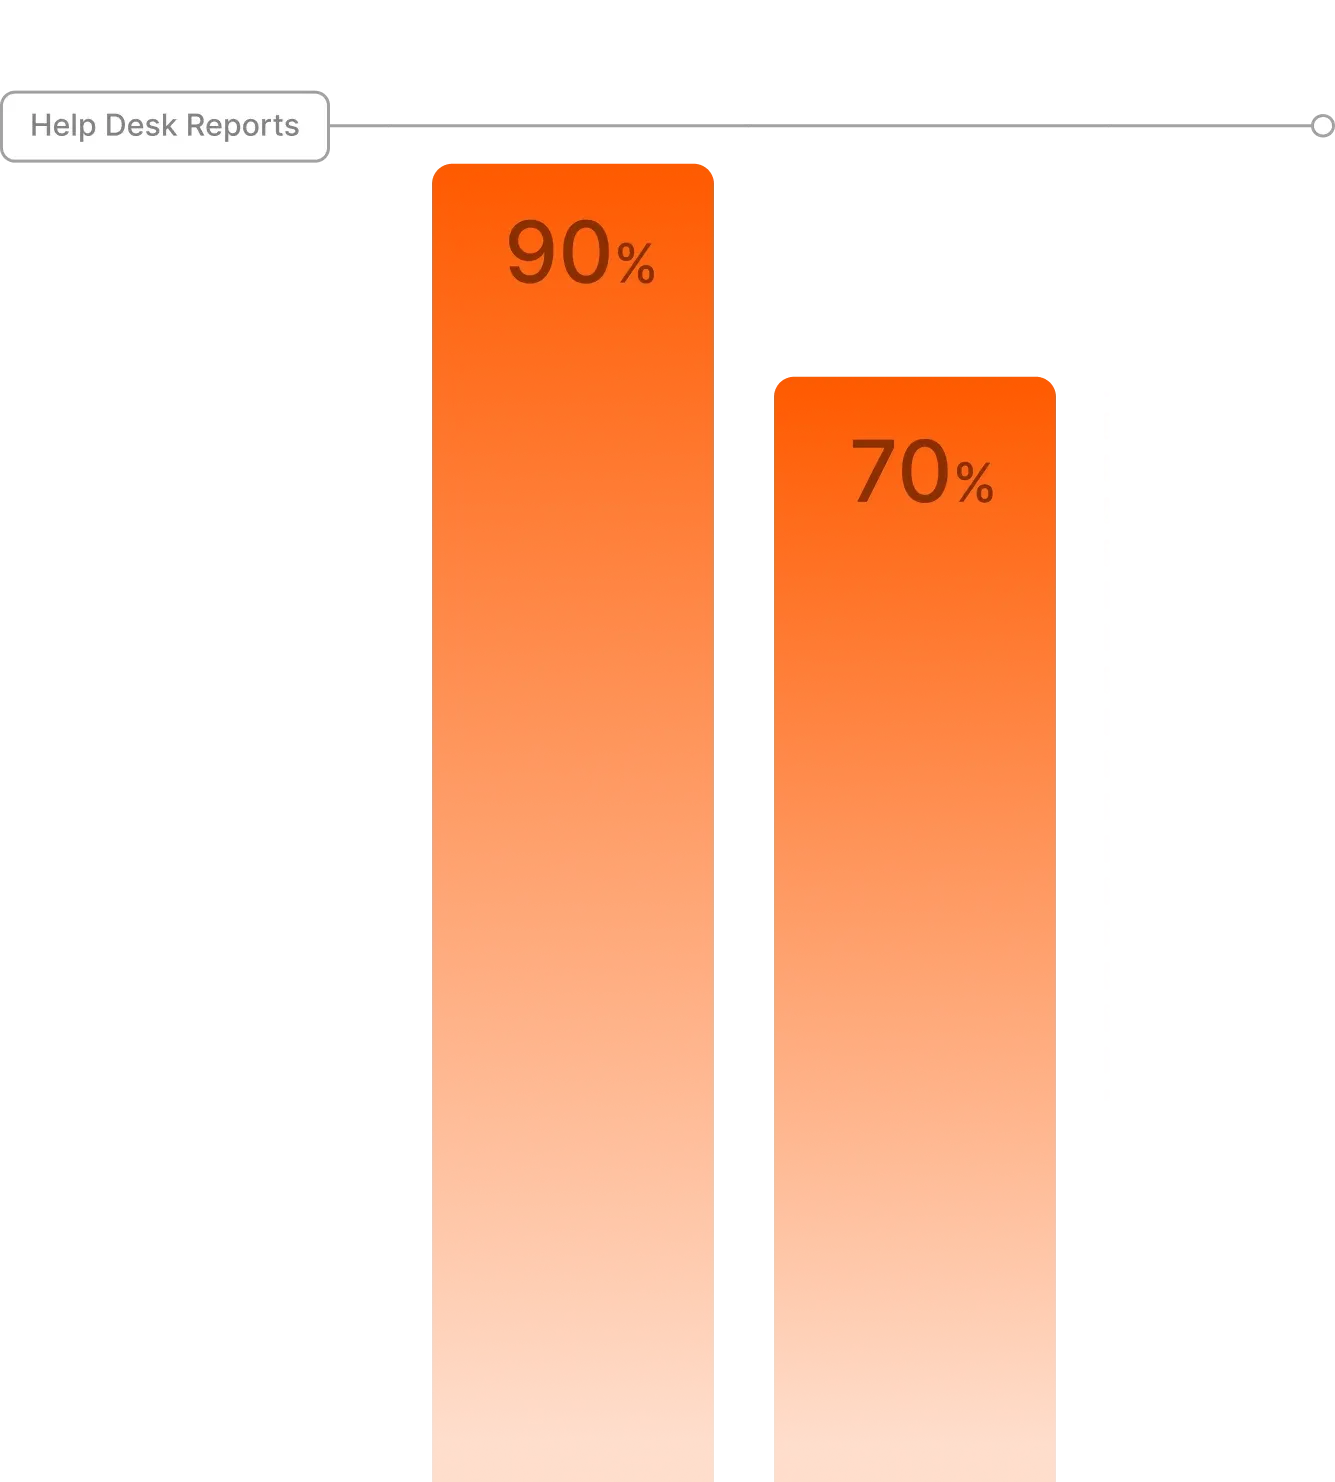
Overview Reports at a Glance
Get a quick summary of all tickets matching your report conditions and selected date range. Instantly understand your support volume and ticket status without digging through data.
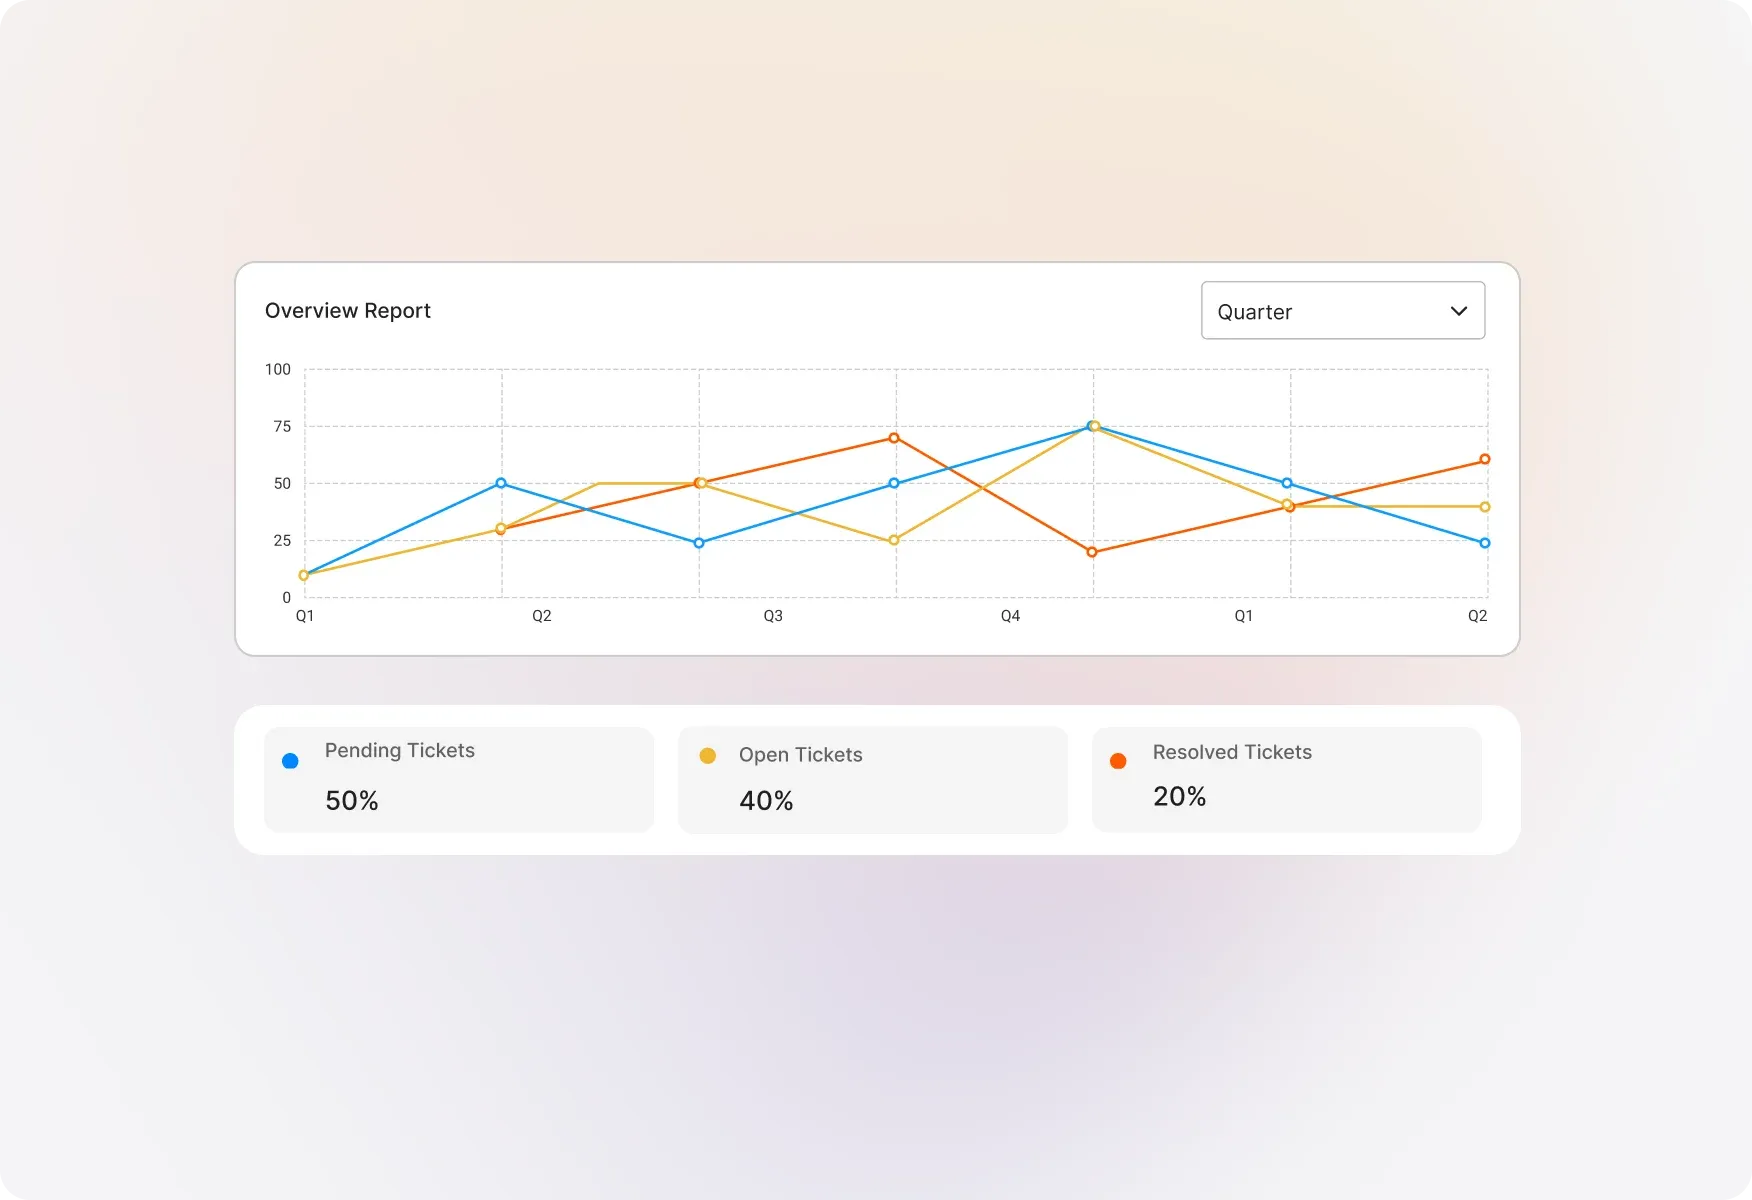
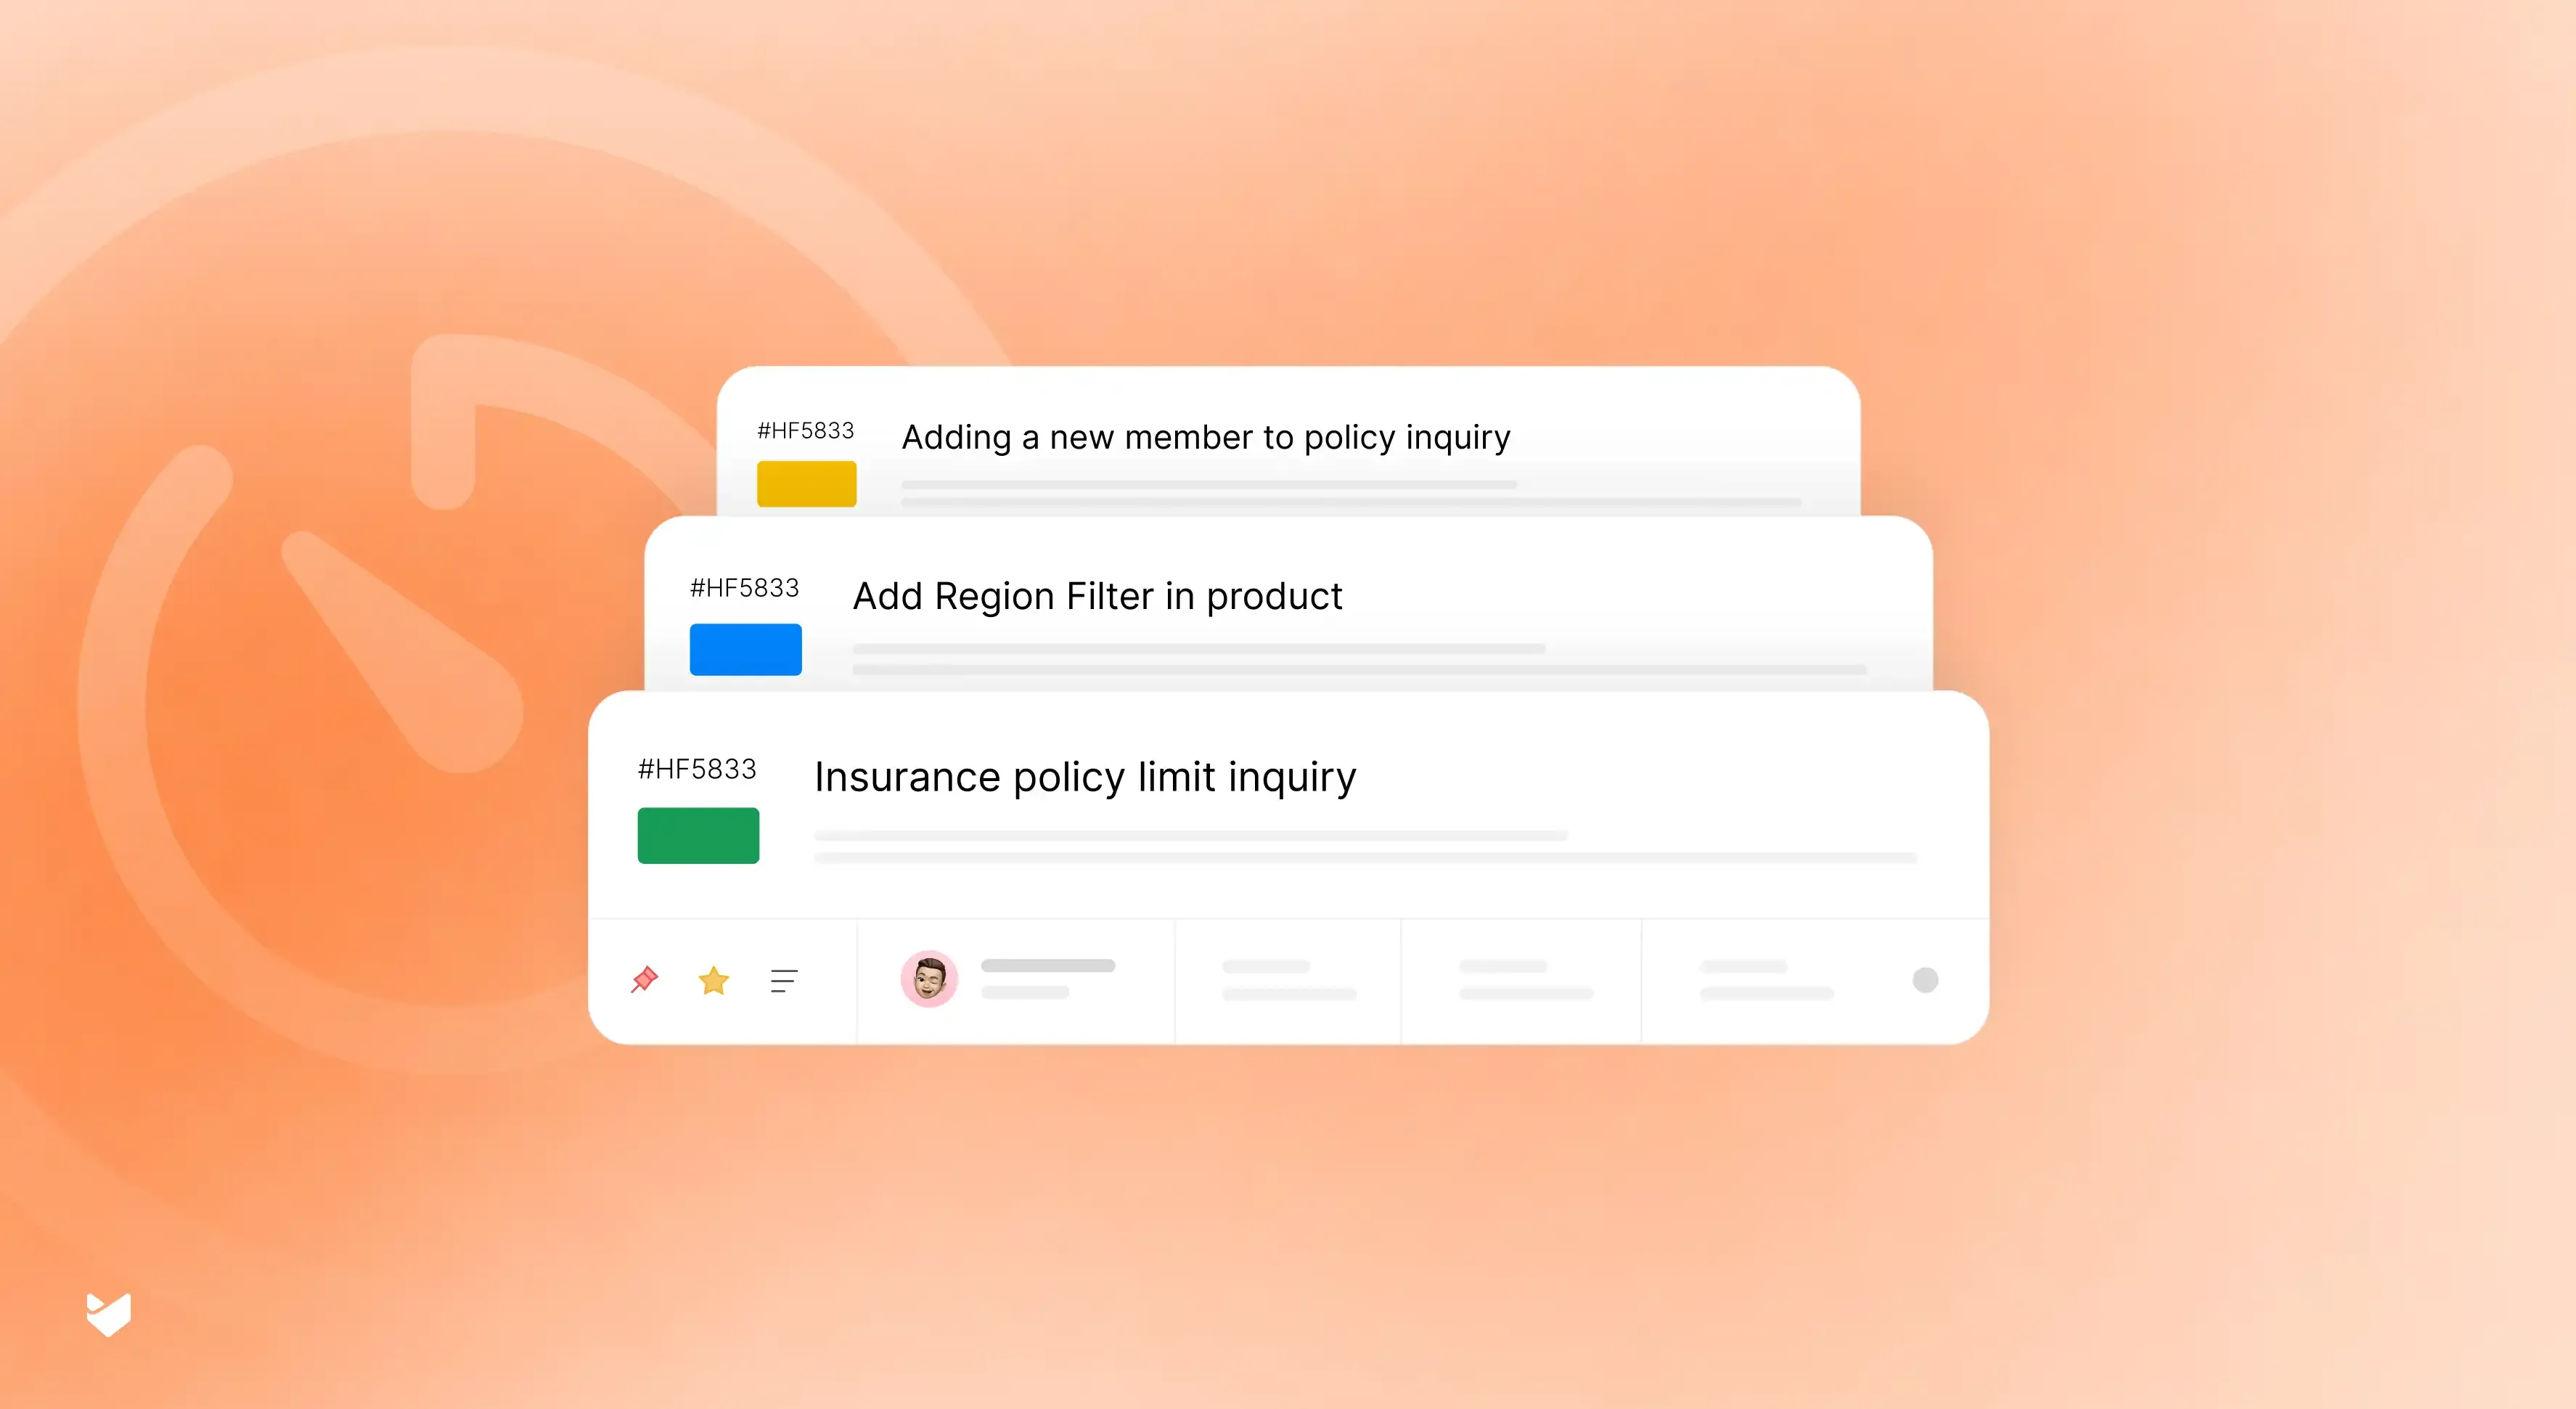
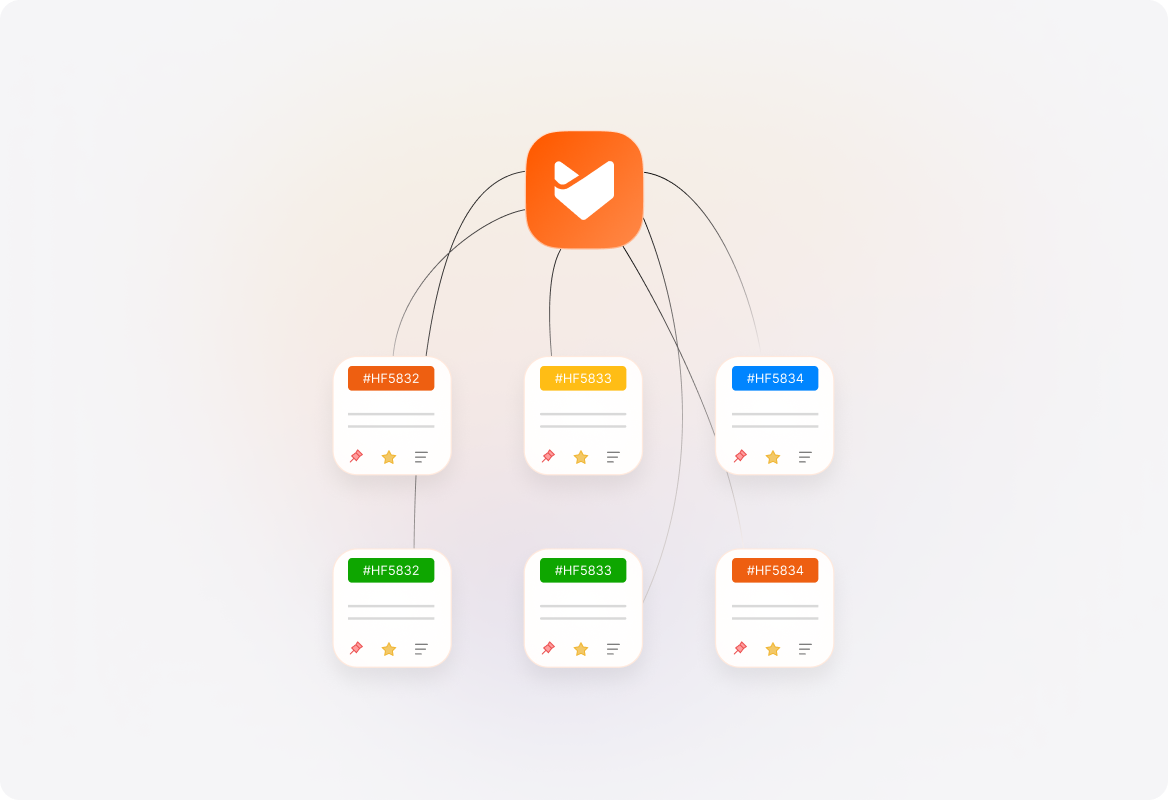
Visual Ticket Distribution
See your tickets in a graphical view, filtered by status, priority, assignee, or category. Spot trends and patterns that help you allocate resources more effectively.

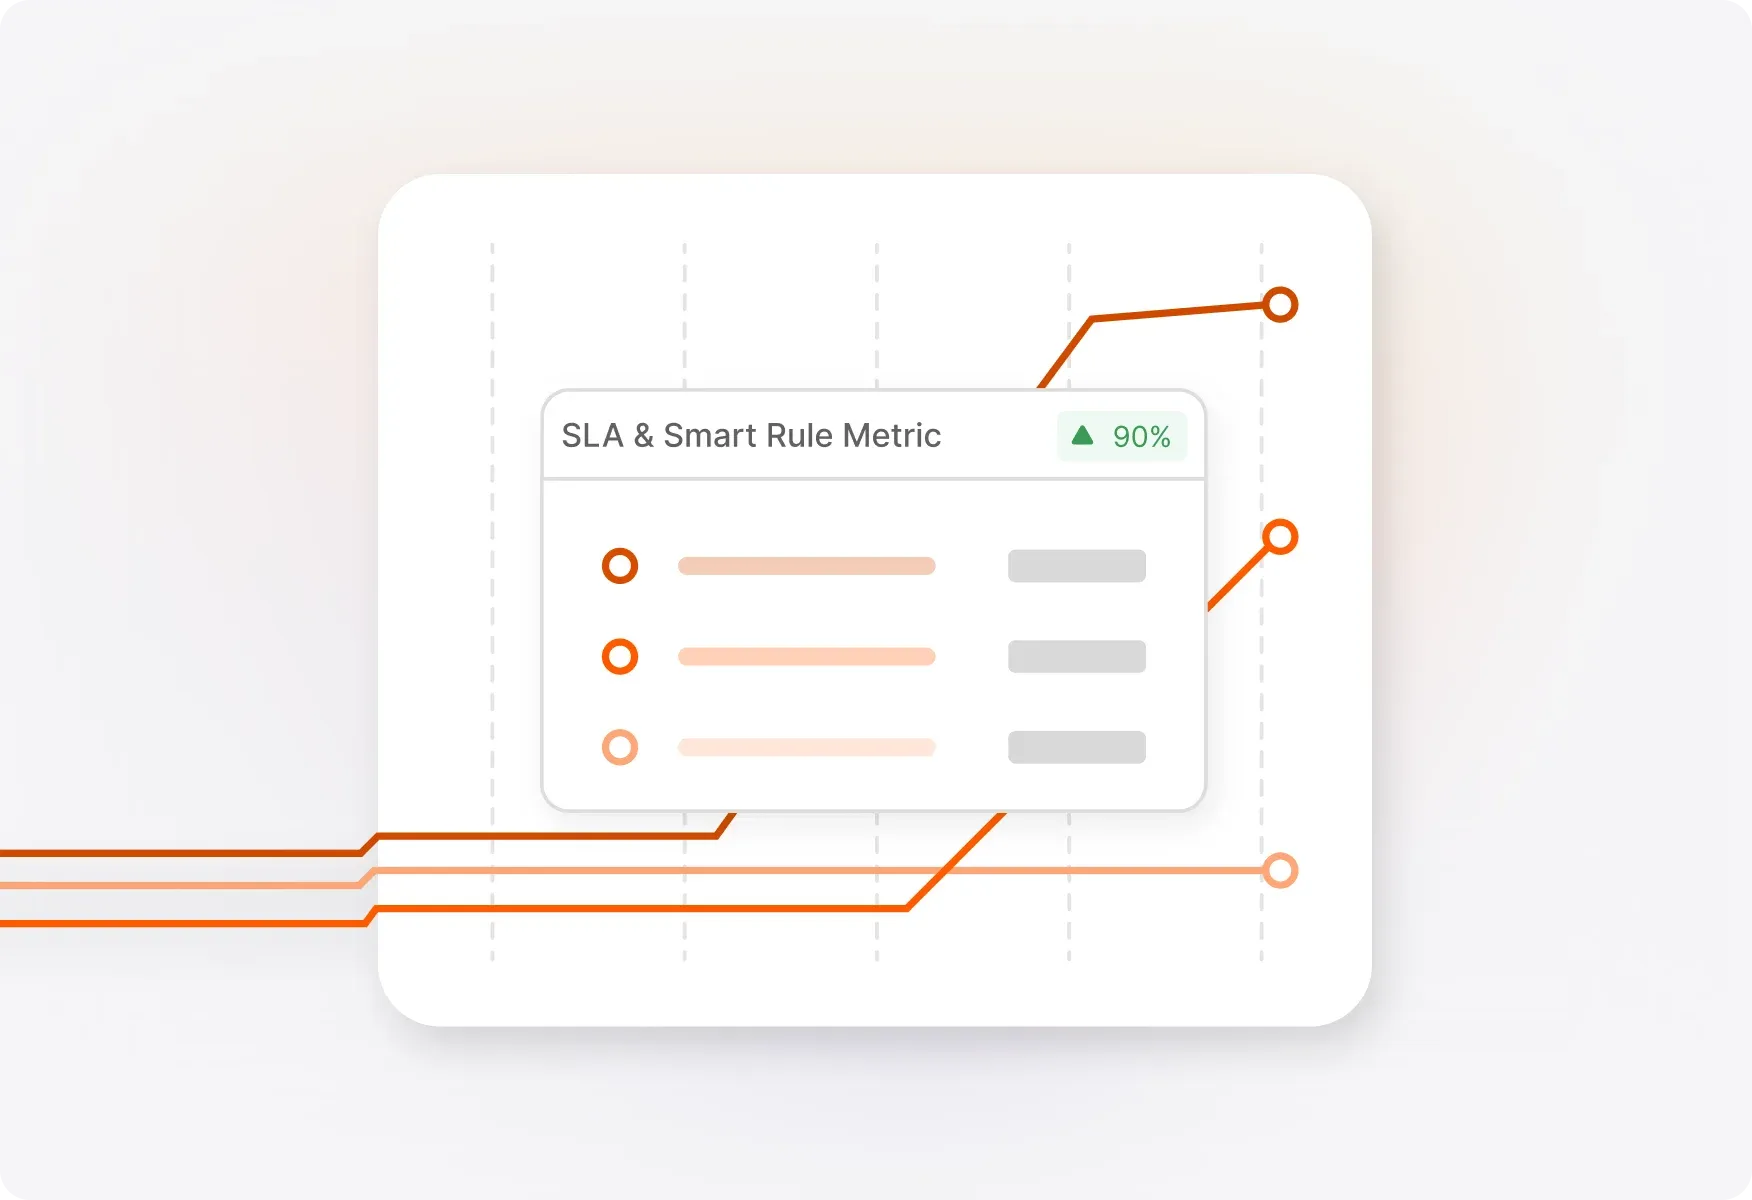
SLA Performance & Smart Rule Metrics
Track how often SLAs and Smart Rules are triggered within your date range. See targets vs. actual achievements to identify where your team excels and where improvements are needed.
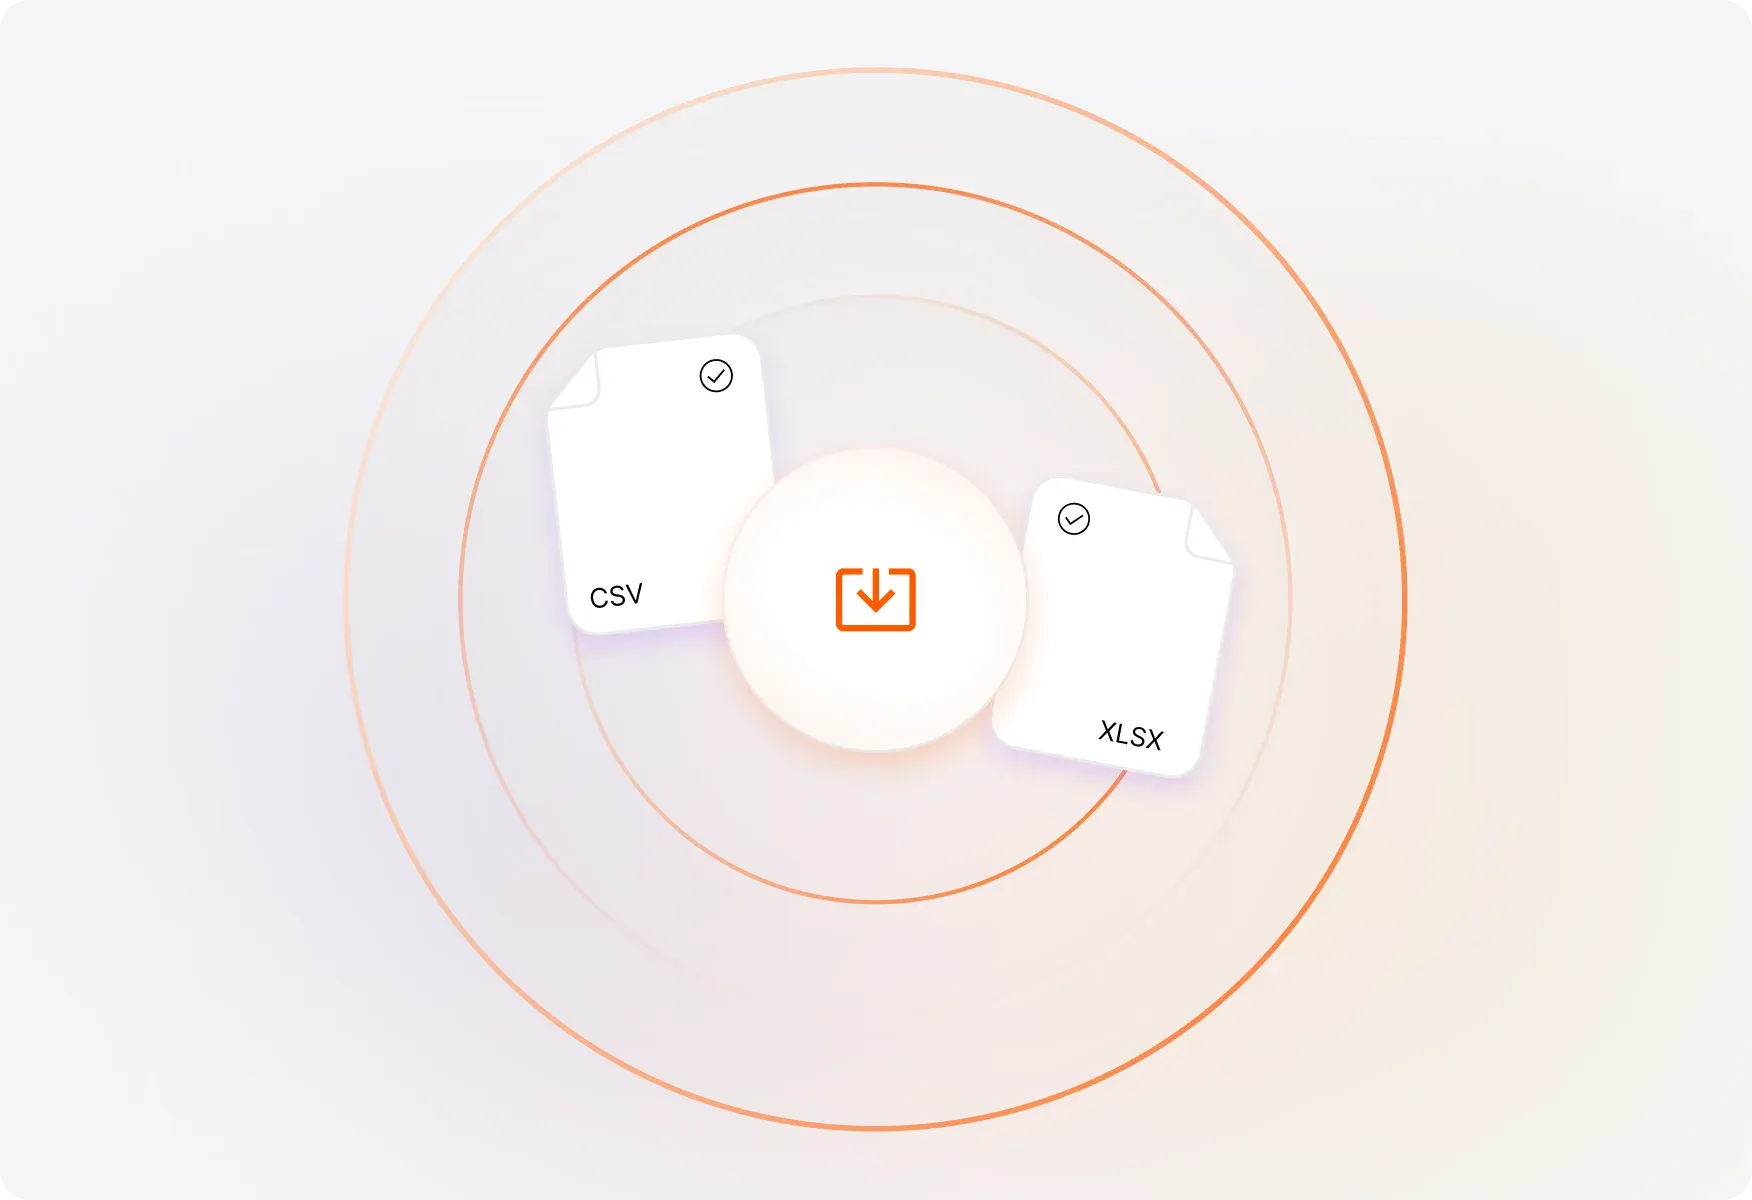
Tabular View with Flexible Exports
Access a detailed list of all tickets matching your report conditions. Export to CSV or Excel with customizable field selection—choose exactly what data you need for your analysis.
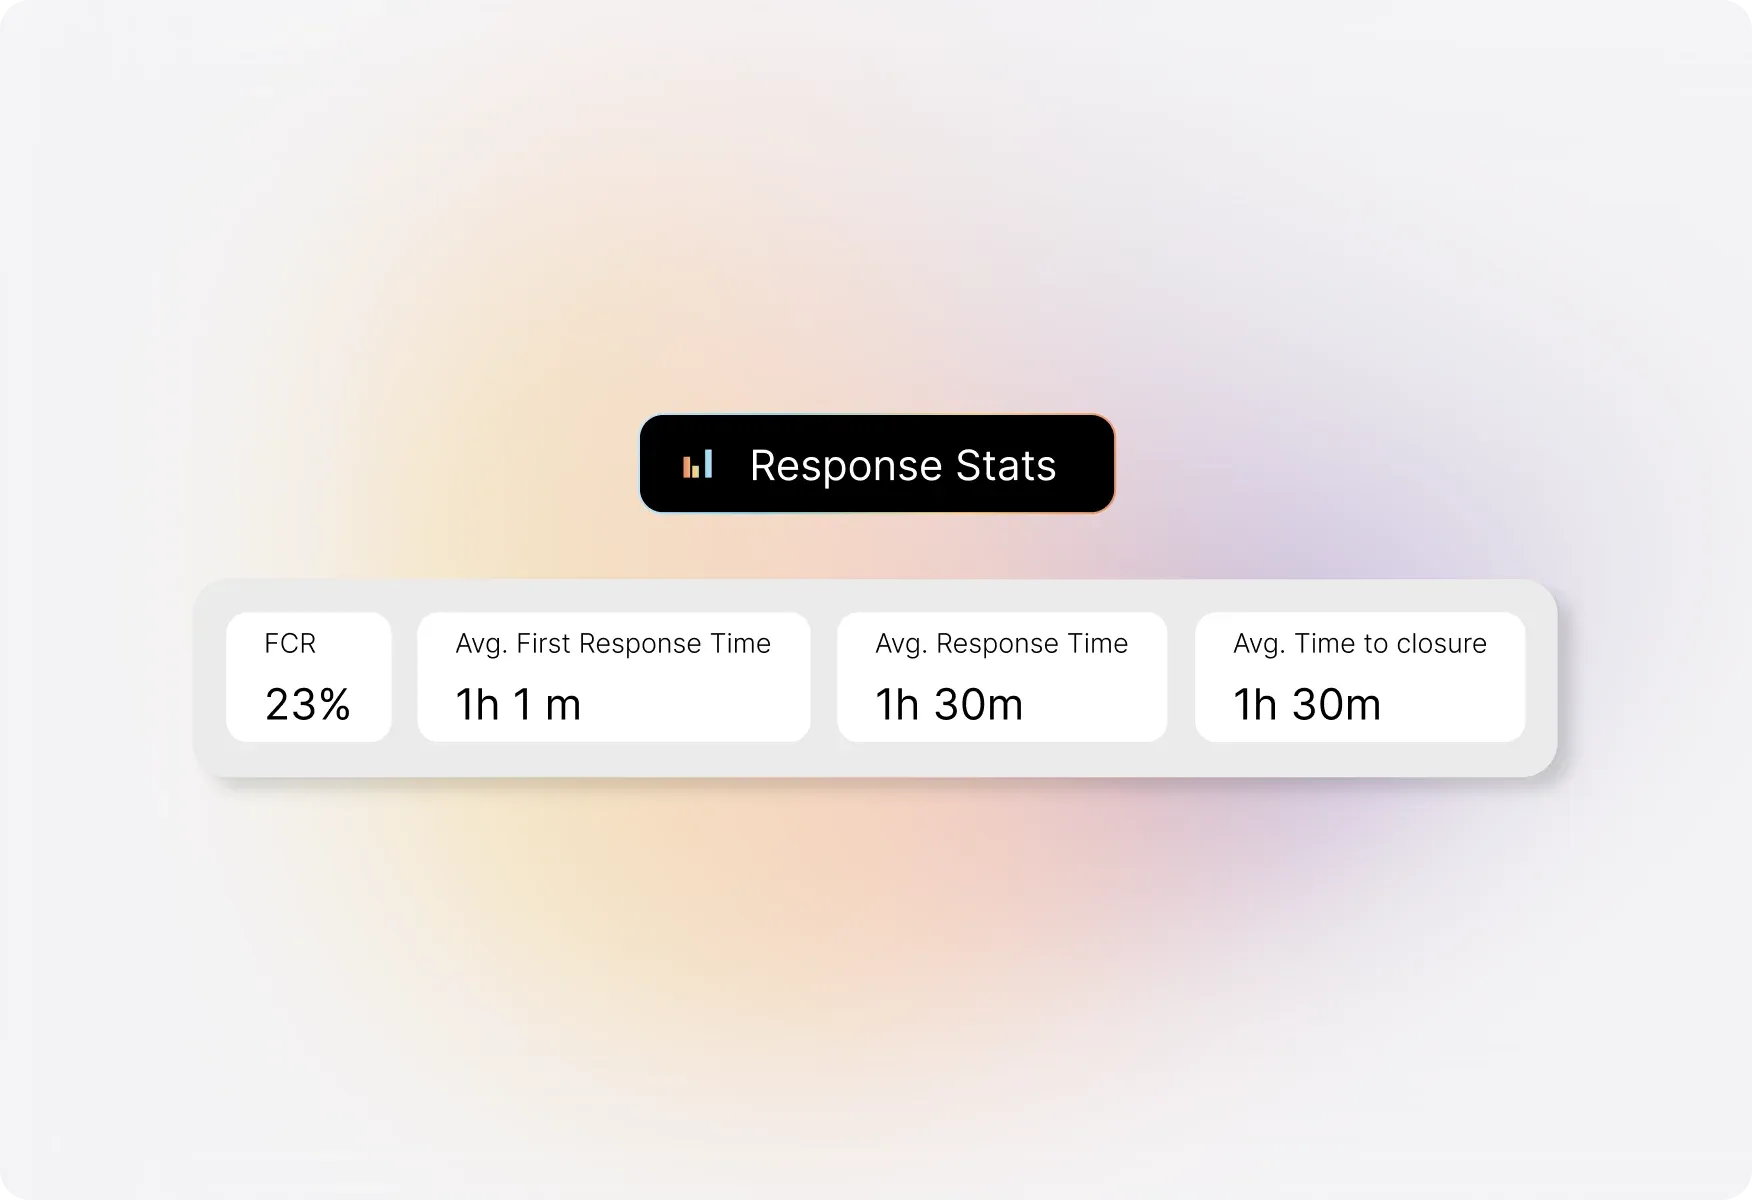
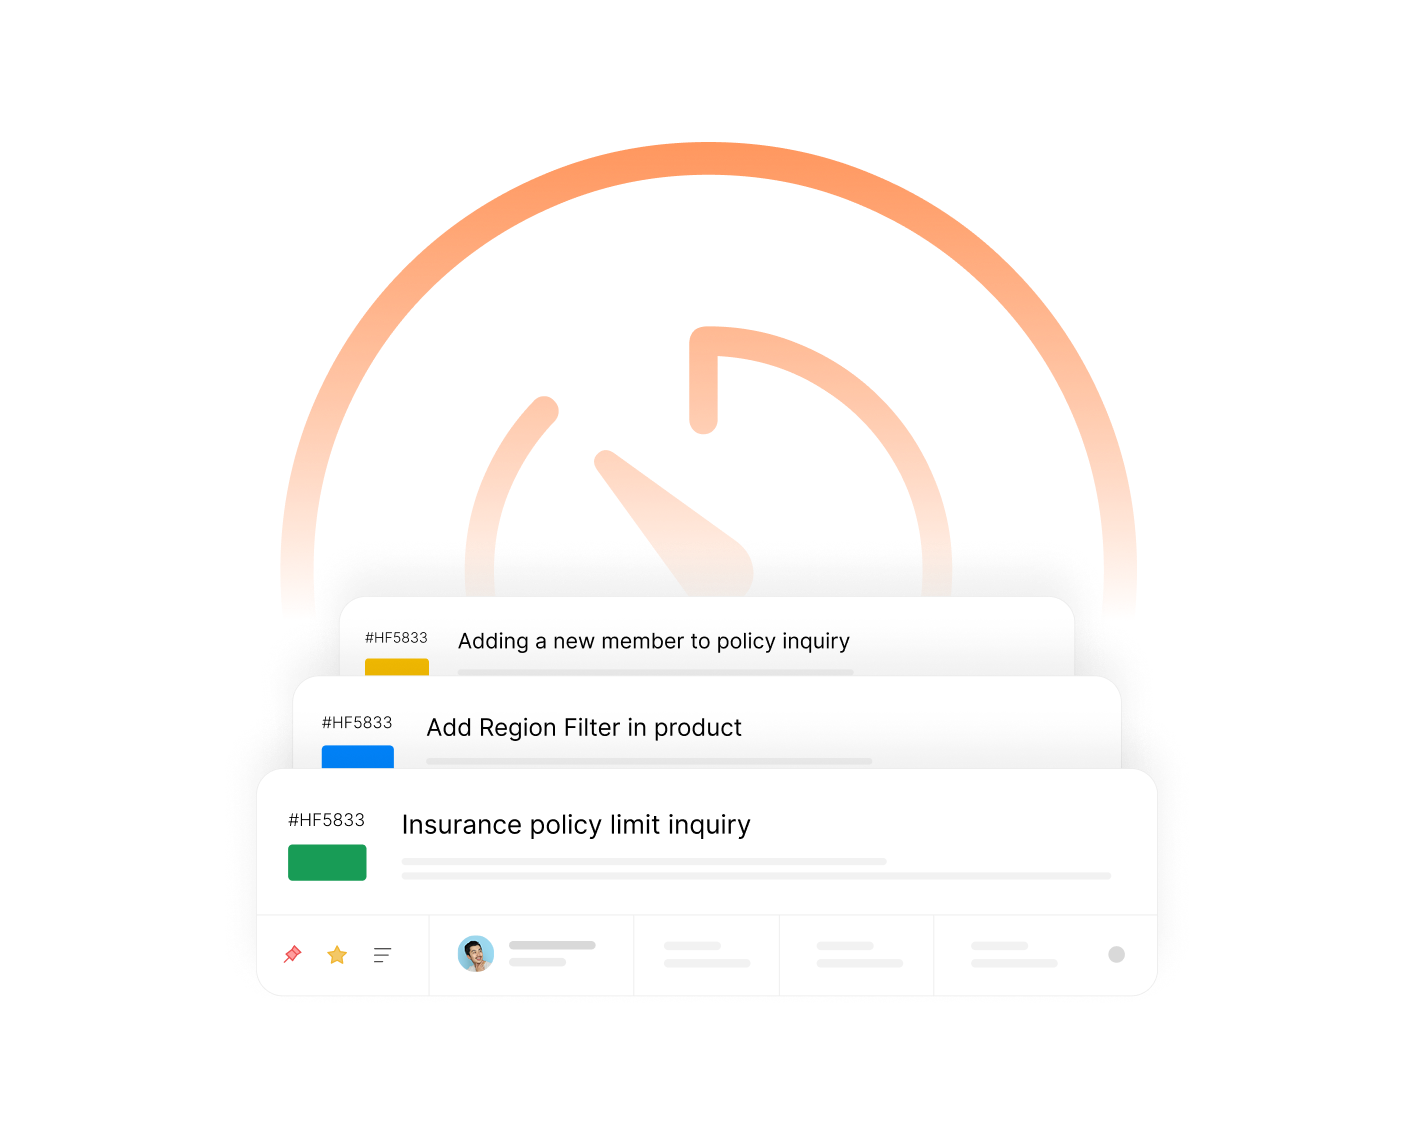
Response Stats That Matter
Monitor average first response time, overall response time, number of replies, and replies to completion. Understand your team's responsiveness at a glance.
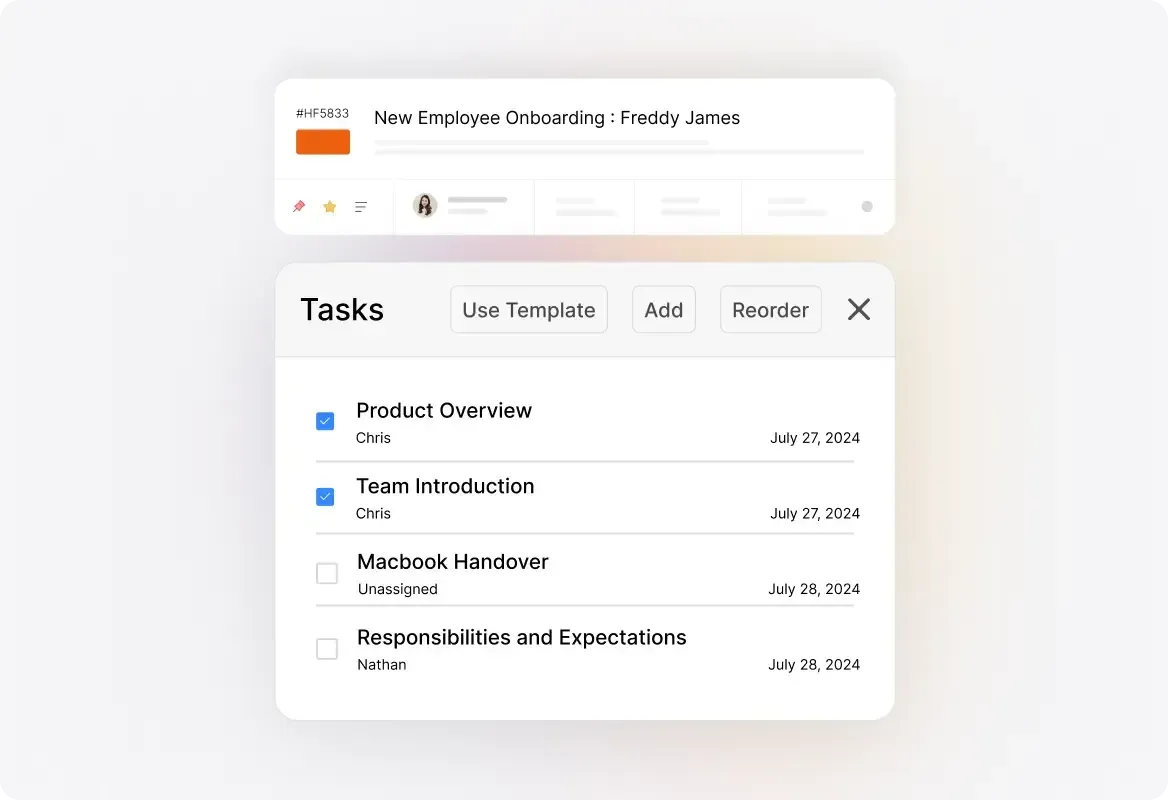
Staff Performance & Activity Tracking
Drill down into per-staff metrics to see individual agent performance. Track response times, ticket handling, and activity levels to identify top performers and coaching opportunities.
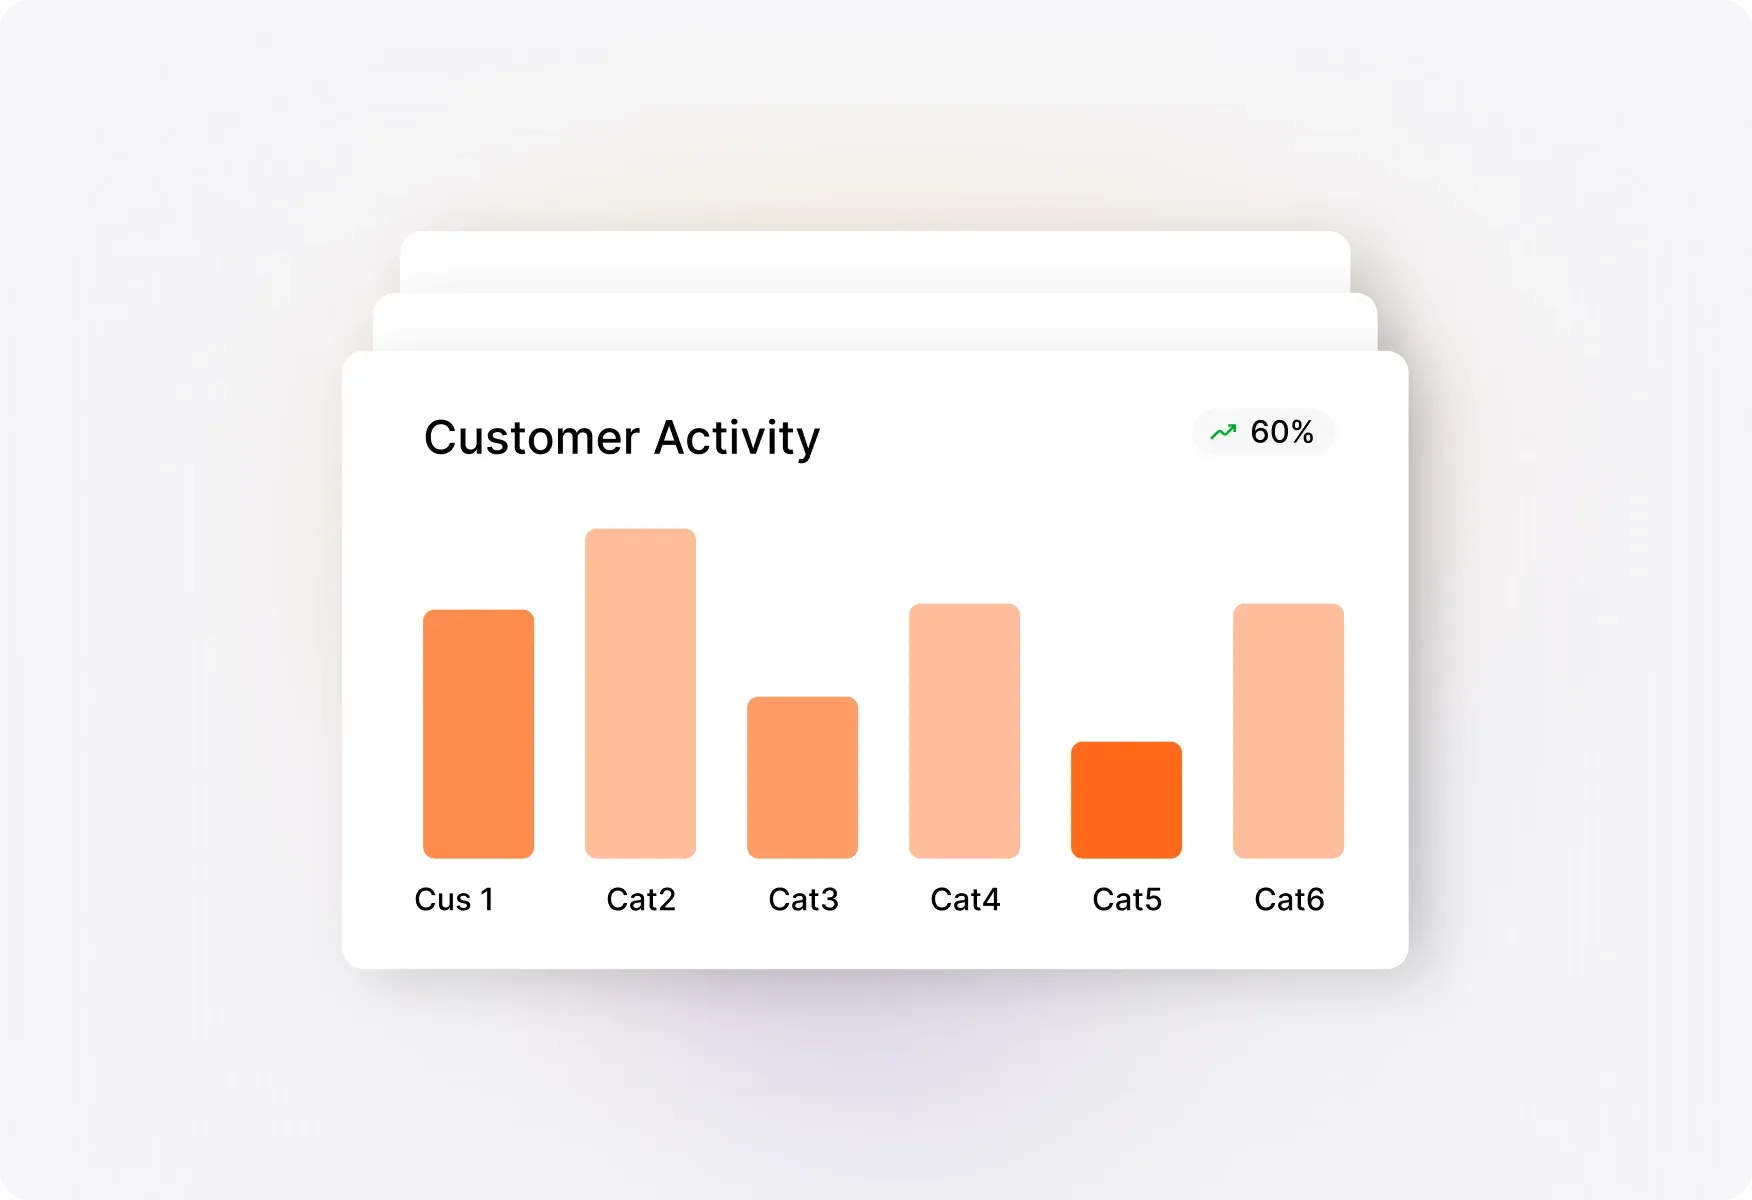
Customer Activity Insights
Identify customers who contact support most frequently, have the most tickets in backlog, or require the most time to resolve. Prioritize high-touch accounts and spot potential issues early.
Explore Other HappyFox Features
FAQ's
Data-Driven Support Starts Here
Stop guessing. Start knowing. Get complete visibility into your help desk performance with HappyFox Reports.

Use Cases
For Business Type
For Industries


Copyright ©2026 HappyFox Inc. All rights reserved.