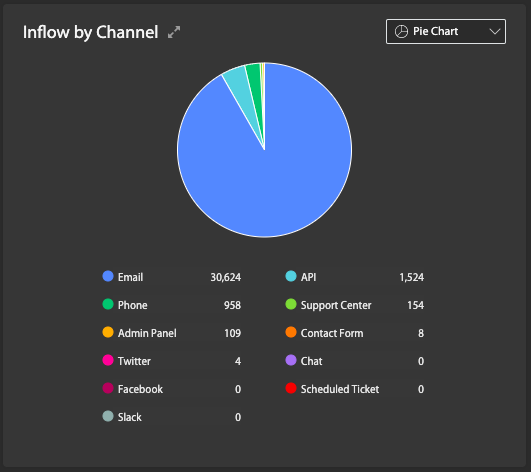
View incoming tickets by their channel and source category. Find out which department needs more agents and which needs less.
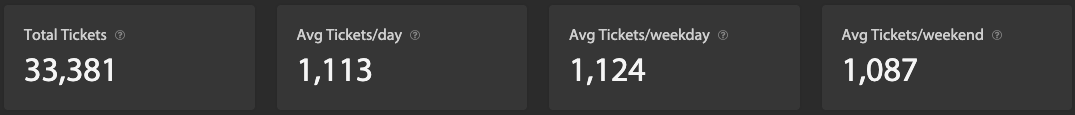
View a quick summary of Avg. tickets created per day, Avg. tickets created per weekday & per weekend to plan your working days.
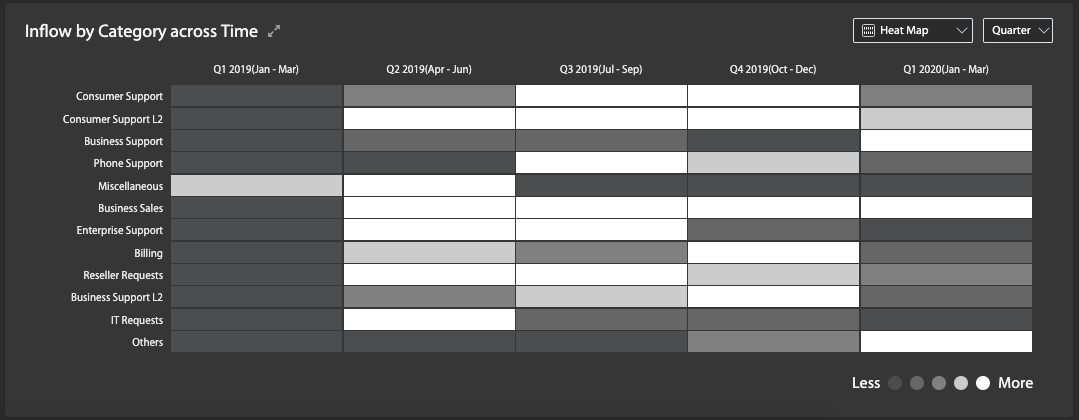
View the overall trend of tickets by viewing inflow by Months or Quarters. Identify which categories have a sudden surge of tickets and derive patterns.
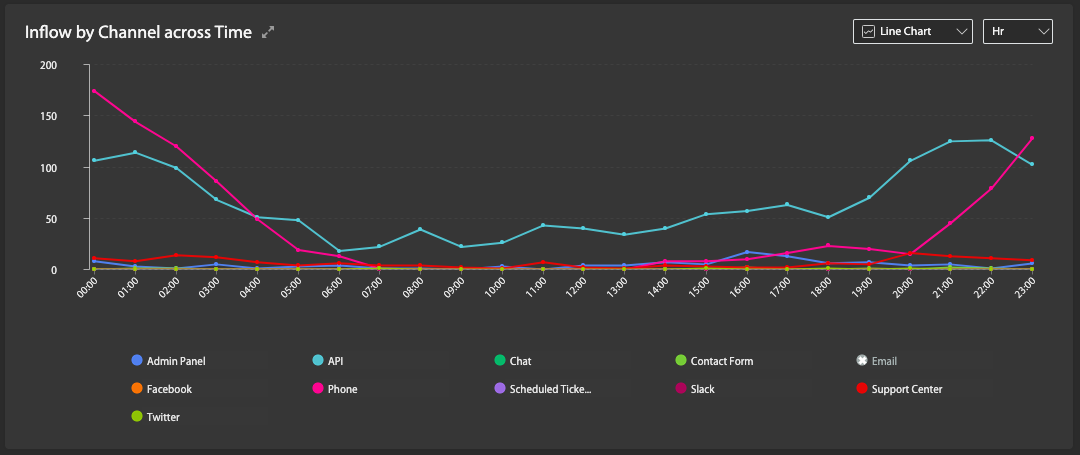
View incoming tickets by Hours or Days. Find out your busiest day of the week and busiest hour of the day using Heatmaps or line graphs.
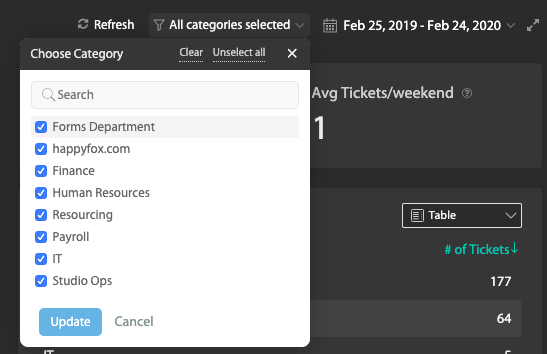
Filter tickets using the date range and categories to monitor Smart rules for certain departments alone for a given period.